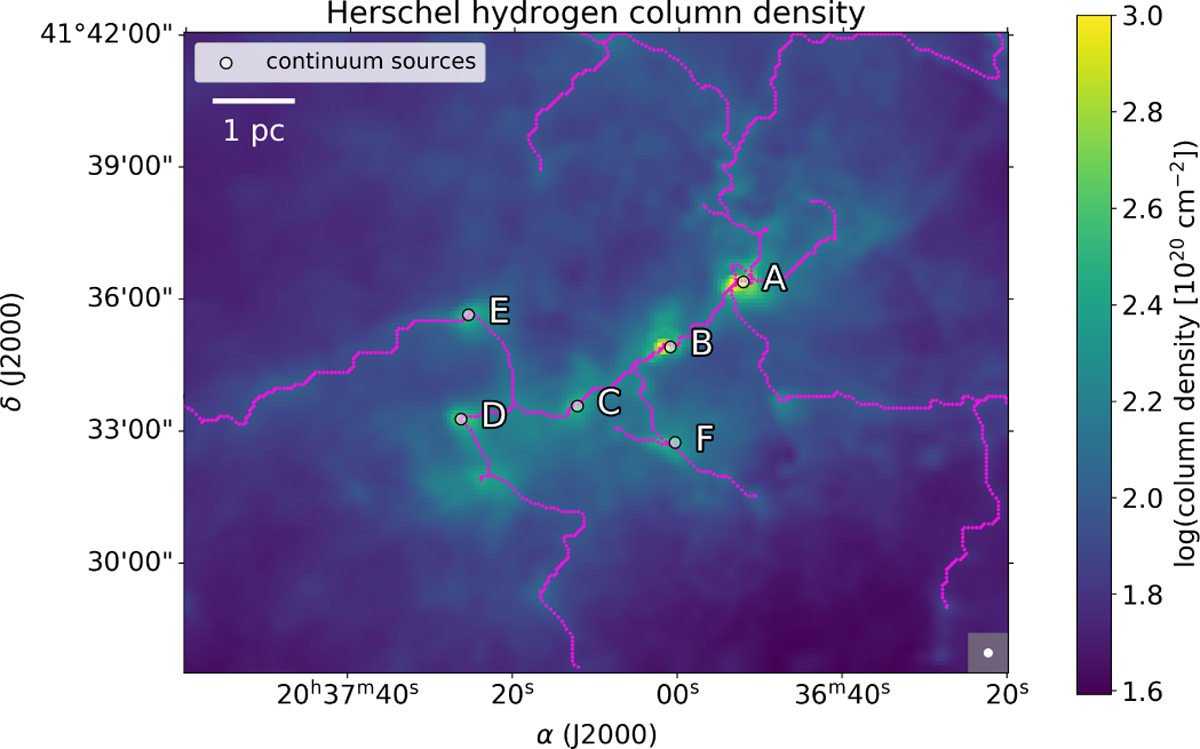
Fig. 5
Download original image
Filaments identified with DisPerSE in the Herschel hydrogen column density data (Marsh et al. 2017). To also show the lower hydrogen column densities, the color scale bar is truncated at 3 × 10²⁰ H2 cm−2, but the peak positions reach much higher column densities >1022 cm−2 (Fig. 1). The intensity maxima of the 3.6 mm continuum emission are labeled A-F. The beam is shown in the bottom-right.
Current usage metrics show cumulative count of Article Views (full-text article views including HTML views, PDF and ePub downloads, according to the available data) and Abstracts Views on Vision4Press platform.
Data correspond to usage on the plateform after 2015. The current usage metrics is available 48-96 hours after online publication and is updated daily on week days.
Initial download of the metrics may take a while.