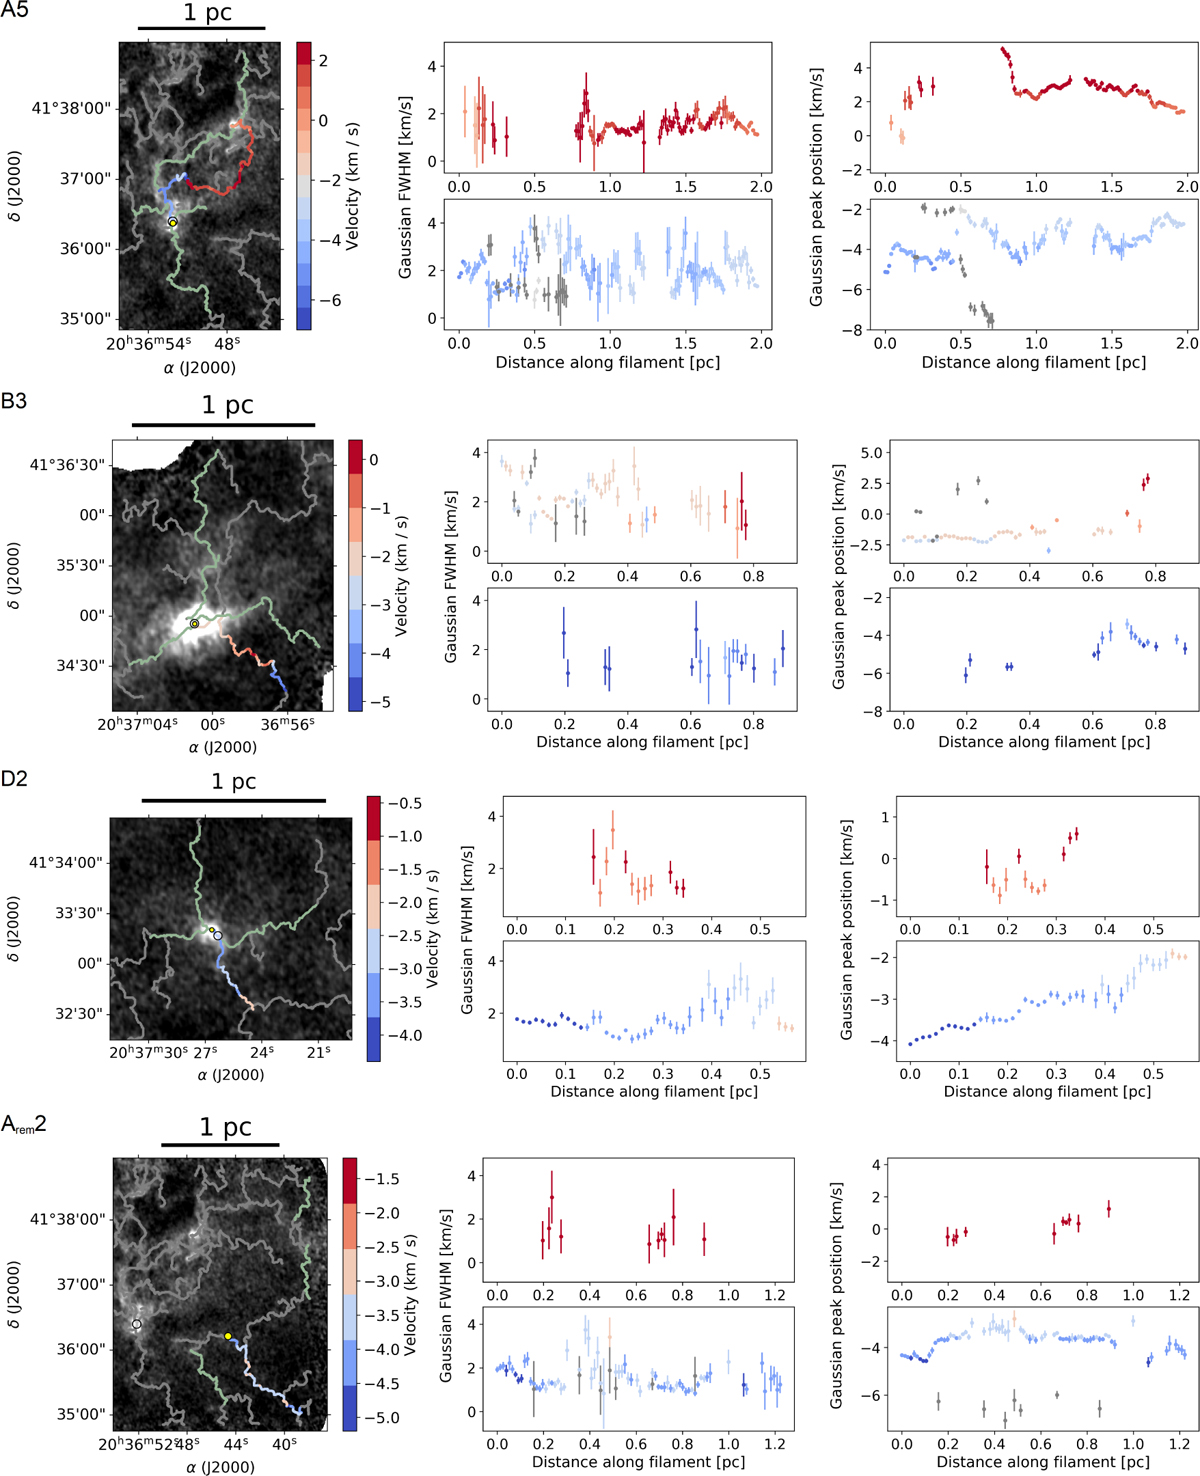
Fig. 8
Download original image
From top to bottom: cores A, B, D, and a remote area close to core A, respectively (A5, B3, D2, Arem2). Images: HCO+(1–0) zeroth moment map (see top left of Fig. 4). The white dot within the core indicates the coordinates of the continuum source, while the yellow dot indicates the filament “origin”, as described in the main text. The filament corresponding to the plots is shown in its velocity colors. Other analyzed filaments are shown in green, their plots can be found in supplementary material at Zenodo (Figs. B.1 and B.16). Plots: Gaussian fitted HCO+ FWHM (left) and peak positions (right) of the spectra within the corresponding filament, plotted over the distance from the core. The yellow dot in the image corresponds to a distance of zero. If there is a significant amount of data points (≥10) for a second spectral Gaussian peak, the positions of the higher velocity peaks (top) and the lower velocity peaks (bottom) are shown in separate plots. The peaks that do not clearly belong to either of the two components are shown in gray. The other data points are colored by their fitted peak positions.
Current usage metrics show cumulative count of Article Views (full-text article views including HTML views, PDF and ePub downloads, according to the available data) and Abstracts Views on Vision4Press platform.
Data correspond to usage on the plateform after 2015. The current usage metrics is available 48-96 hours after online publication and is updated daily on week days.
Initial download of the metrics may take a while.