Open Access
Fig. 2
Download original image
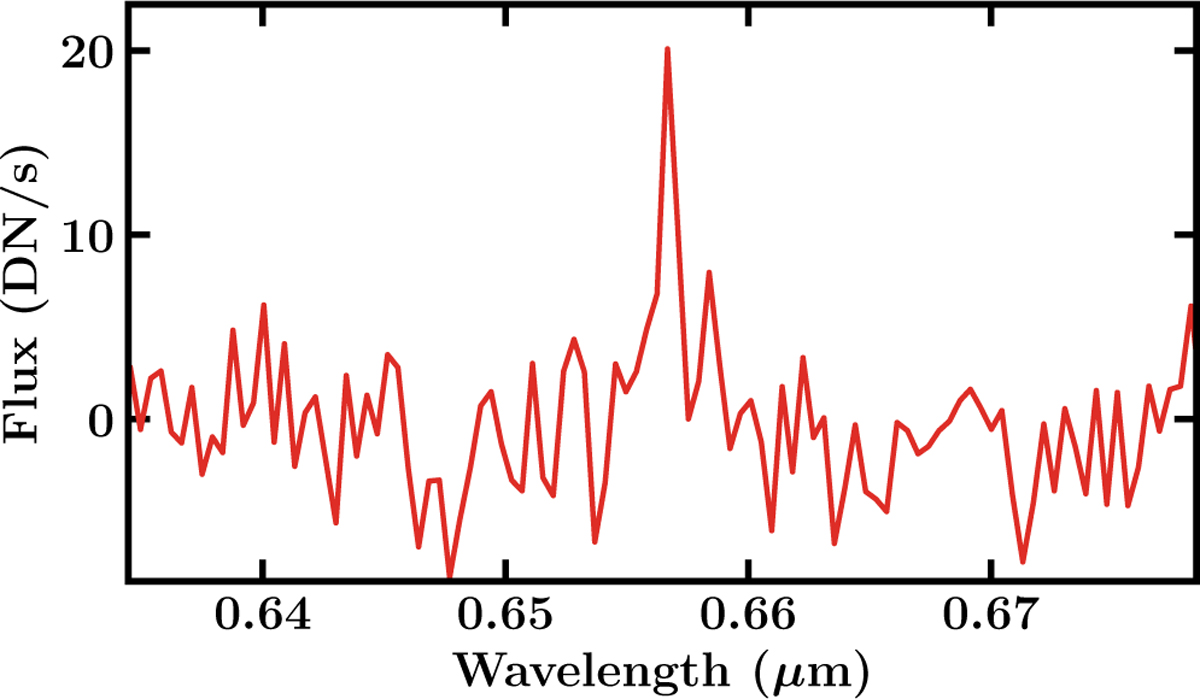
Excess Hα emission from a minor flare. Note that the peak emission aligns with the small flux increase seen in the white light curve just before mid-transit. Ultimately, this does not significantly impact the final transmission spectrum, as discussed in Section 2.1.
Current usage metrics show cumulative count of Article Views (full-text article views including HTML views, PDF and ePub downloads, according to the available data) and Abstracts Views on Vision4Press platform.
Data correspond to usage on the plateform after 2015. The current usage metrics is available 48-96 hours after online publication and is updated daily on week days.
Initial download of the metrics may take a while.