Fig. 3
Download original image
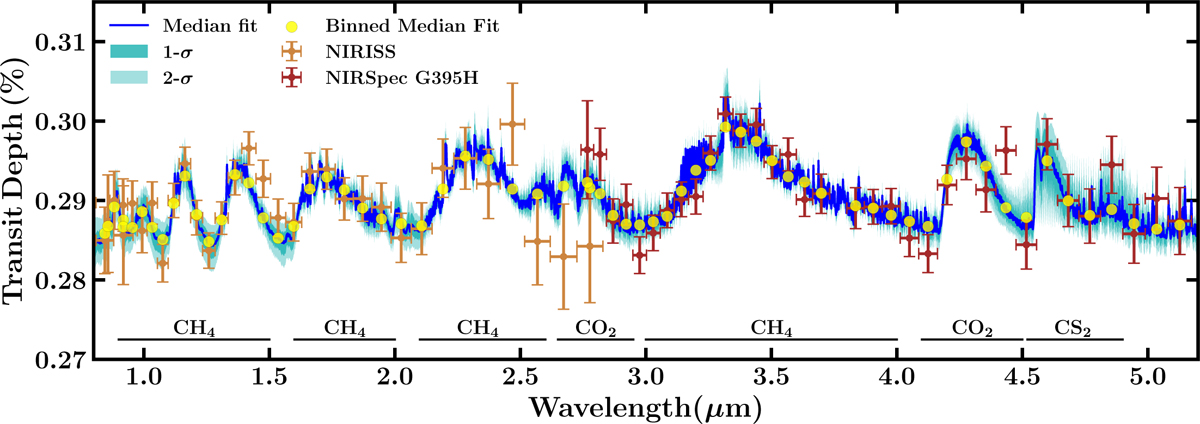
JWST transmission spectrum of TOI-270 d. Orange errorbars correspond to NIRISS observations, presented in this work, while dark red errorbars correspond to NIRSpec G395H observations presented by HM24. The NIRISS observations were binned down to R=25 for order 1 and R=12 for Order 2 for visual clarity. The blue curve denotes the median retrieved spectral fit obtained with our canonical retrieval, described in Section 3. Darker and lighter turquoise shaded regions denote the spectral 1- and 2-σ contours corresponding to the spectral fit. Yellow dots denote the median spectrum binned to the resolution of the datapoints. The NIRISS data are vertically offset by +28 ppm, which is the median offset retrieved for our canonical model.
Current usage metrics show cumulative count of Article Views (full-text article views including HTML views, PDF and ePub downloads, according to the available data) and Abstracts Views on Vision4Press platform.
Data correspond to usage on the plateform after 2015. The current usage metrics is available 48-96 hours after online publication and is updated daily on week days.
Initial download of the metrics may take a while.