Fig. 7
Download original image
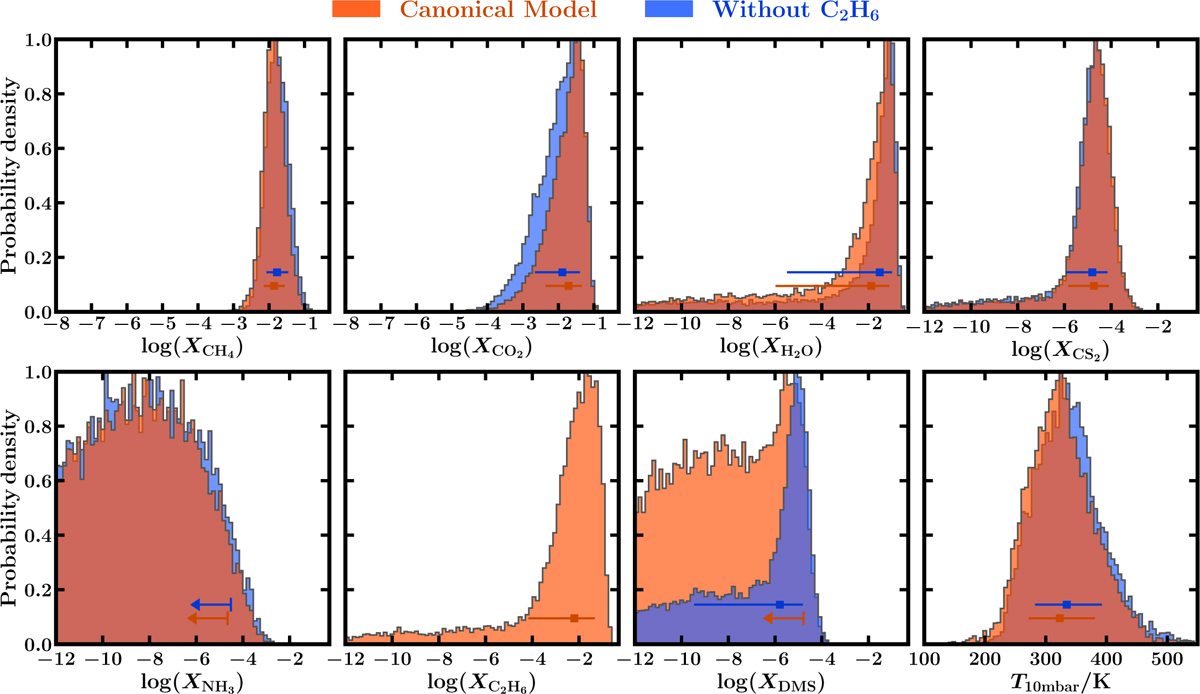
Posterior probability distributions of key molecular species and photospheric temperature retrieved with the canonical atmospheric model described in Section 3, shown in orange. Also shown in blue are the corresponding results with C2H6 removed from the model, whereby a peak in the DMS posterior is found. Horizontal points with errorbars denote the median and 1-σ interval of the distribution of the same colour, while arrows denote 2-σ upper limits.
Current usage metrics show cumulative count of Article Views (full-text article views including HTML views, PDF and ePub downloads, according to the available data) and Abstracts Views on Vision4Press platform.
Data correspond to usage on the plateform after 2015. The current usage metrics is available 48-96 hours after online publication and is updated daily on week days.
Initial download of the metrics may take a while.