Fig. B.1
Download original image
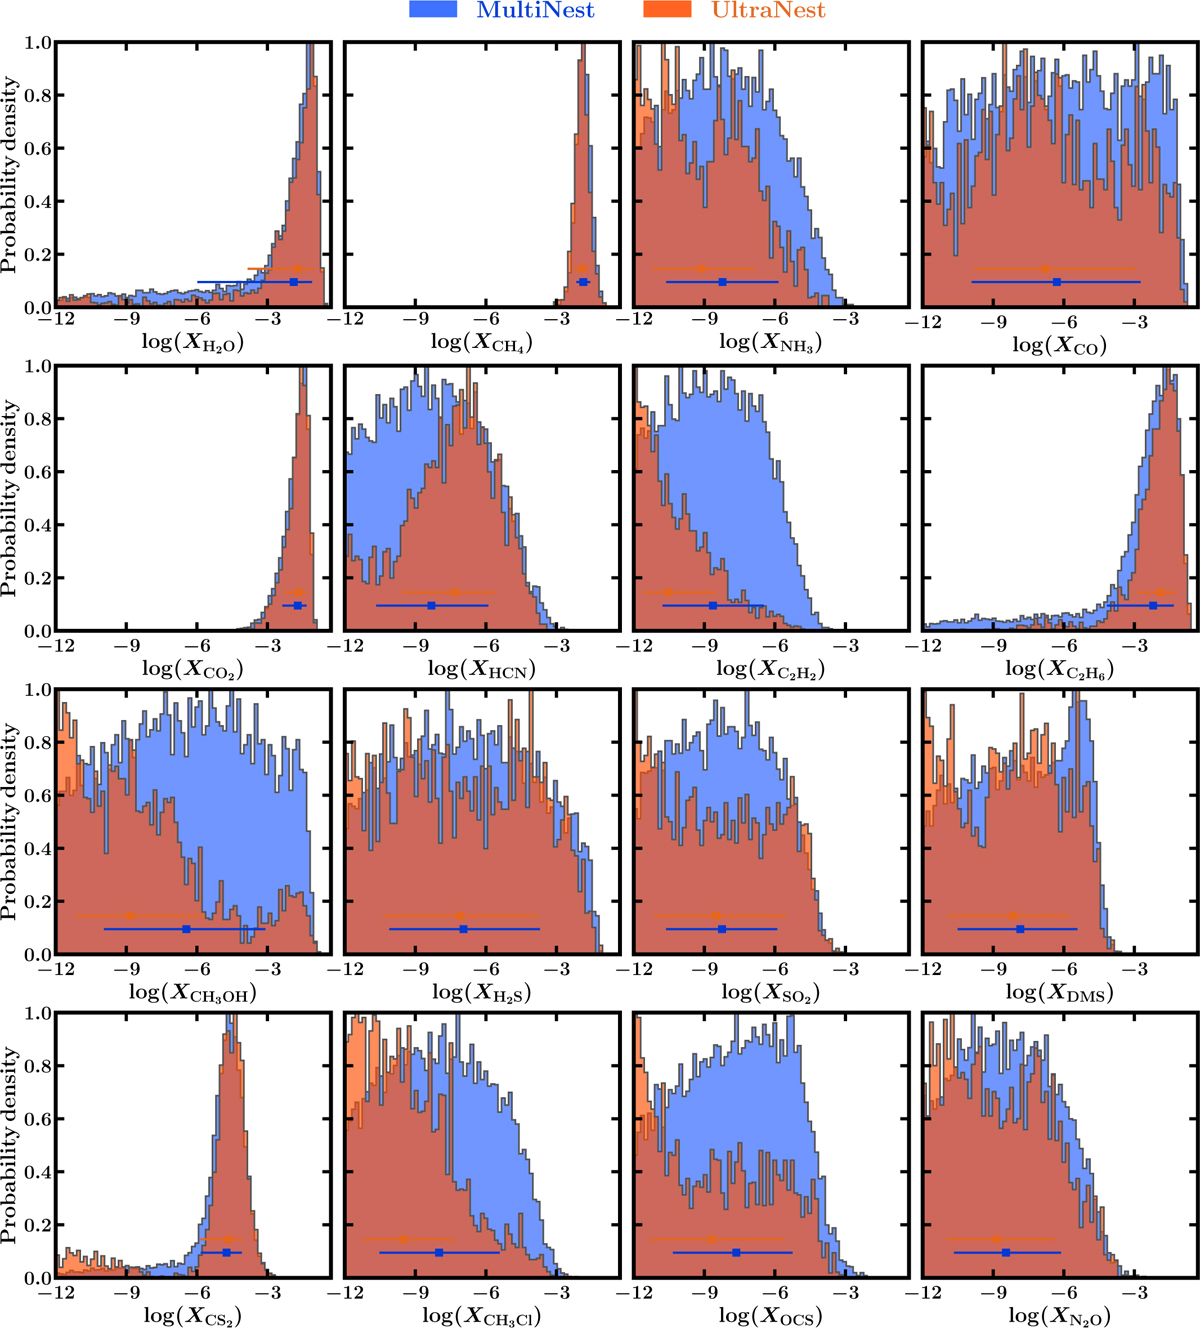
Mixing ratio posterior distributions obtained using the canonical atmospheric model described in Section 3 using the MultiNest (orange) and UltraNest (blue) nested sampling implementations. The orange posterior distributions for the MultiNest retrieval are the same as the ones shown in Figures 7 and A.1 Horizontal orange and blue points with errorbars denote the median and 1-σ intervals for the posterior distribution of the same colour.
Current usage metrics show cumulative count of Article Views (full-text article views including HTML views, PDF and ePub downloads, according to the available data) and Abstracts Views on Vision4Press platform.
Data correspond to usage on the plateform after 2015. The current usage metrics is available 48-96 hours after online publication and is updated daily on week days.
Initial download of the metrics may take a while.