Fig. 1.
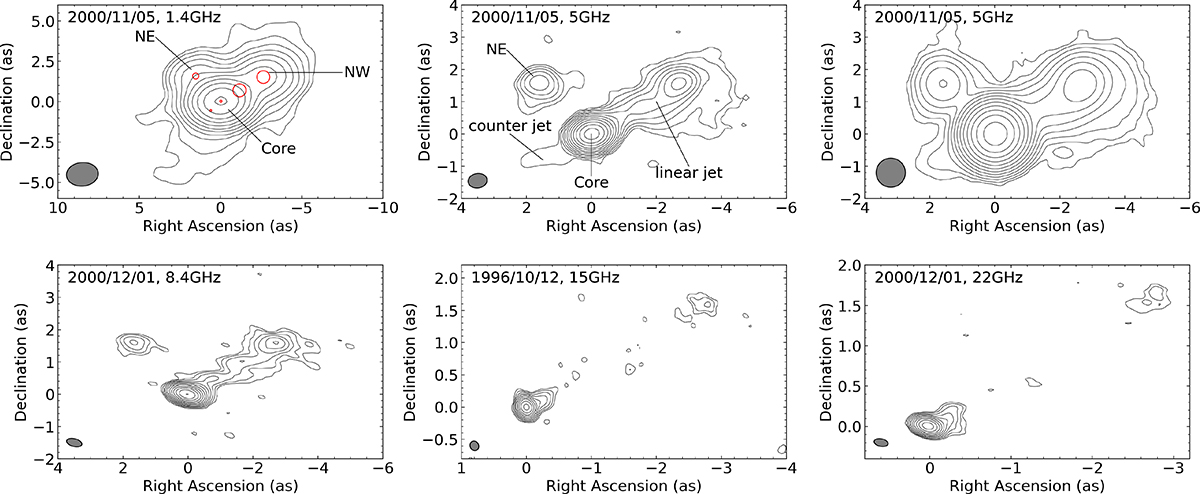
Download original image
VLA flux density images of 0954+556 at kpc scale. The contours are drawn at –1, 1, 2, 4, 8, …, of the first contour level (3σrms). The synthesized beams are plotted in the bottom left corner of each image. In the top left panel, the red circles overlapping the contours present the results of modelfit. In the top middle panel, the 5 GHz image shows a weak counter-jet. To better reveal the weak counter-jet, the 5 GHz image was restored with a circular beam of 900 mas, as shown in the top right panel.
Current usage metrics show cumulative count of Article Views (full-text article views including HTML views, PDF and ePub downloads, according to the available data) and Abstracts Views on Vision4Press platform.
Data correspond to usage on the plateform after 2015. The current usage metrics is available 48-96 hours after online publication and is updated daily on week days.
Initial download of the metrics may take a while.