Fig. 3.
Download original image
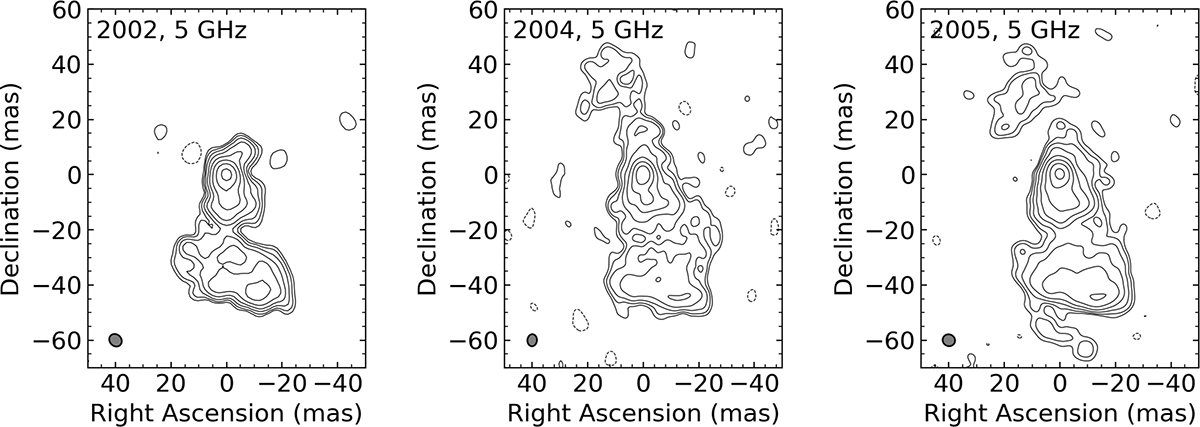
VLBA flux density images of 0954+556 at 5 GHz. Left panel: Reconstructed image of the visibilities from a combination of data on 20 July 2002 and 22 September 2002. Middle panel: Reconstructed image of the visibilities from a combination of data on 14 June 2004 and 3 November 2004. Right panel: Reconstructed image of the visibilities from a combination of data on 4 April 2005 and 18 August 2005. The contours are drawn at –1, 1, 2, 4, 8, …, of the first contour level (3σrms). The synthesized beams are plotted in the bottom left corner of each image.
Current usage metrics show cumulative count of Article Views (full-text article views including HTML views, PDF and ePub downloads, according to the available data) and Abstracts Views on Vision4Press platform.
Data correspond to usage on the plateform after 2015. The current usage metrics is available 48-96 hours after online publication and is updated daily on week days.
Initial download of the metrics may take a while.