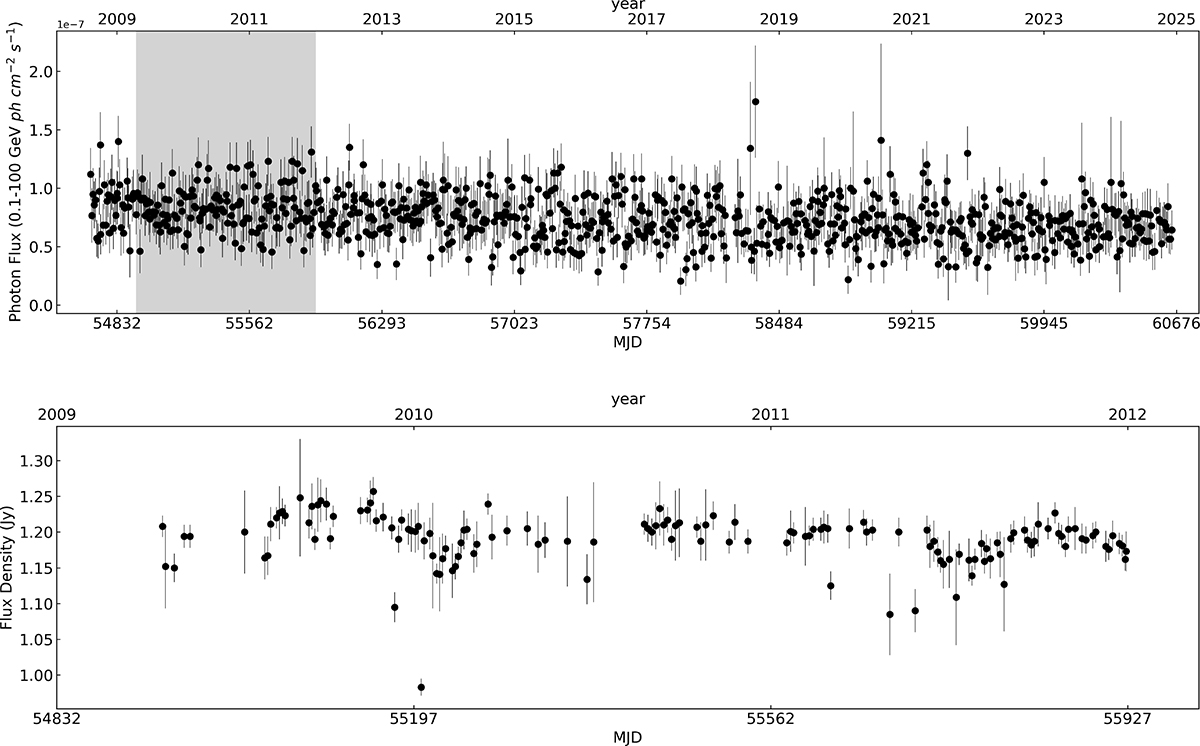
Fig. 4.
Download original image
Light curve of 0954+556. The top panel shows a Fermi-LAT γ-ray light curve of 0954+556 from 8 August 2008 to 6 December 2024, divided into seven-day bins. All points are plotted along with their statistical errors. The bottom panel is the radio light curve obtained from OVRO at 15 GHz, from 19 April 2009 to 30 December 2011, with an interval of four days. The gray area in the top panel corresponds to the bottom panel.
Current usage metrics show cumulative count of Article Views (full-text article views including HTML views, PDF and ePub downloads, according to the available data) and Abstracts Views on Vision4Press platform.
Data correspond to usage on the plateform after 2015. The current usage metrics is available 48-96 hours after online publication and is updated daily on week days.
Initial download of the metrics may take a while.