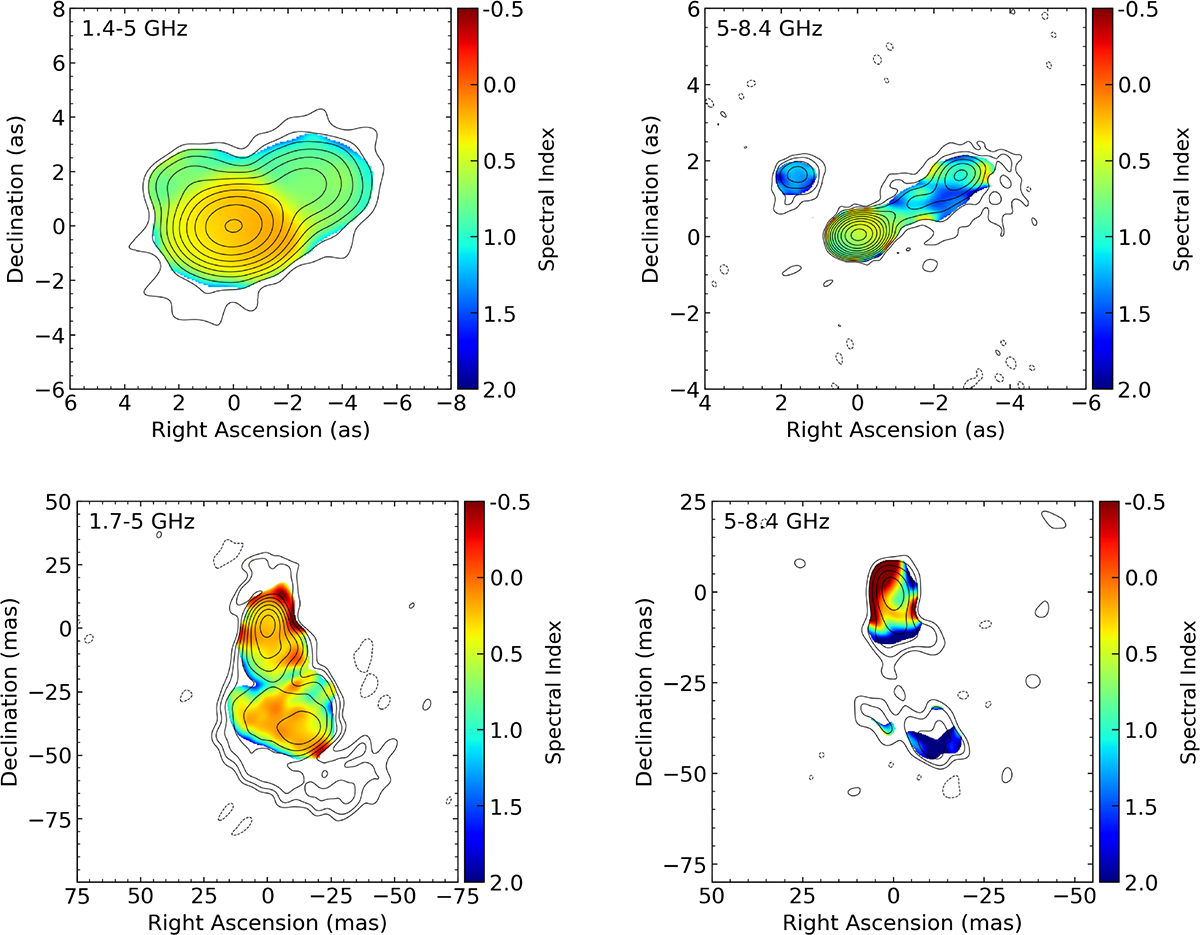
Fig. 5.
Download original image
Spectral index distribution maps of 0954+556. From left to right, the panels show the distribution of spectral index between 1.4 and 5 GHz at kpc scales, between 5 and 8.4 GHz at kpc scales, between 1.7 and 5 GHz at pc scales, and between 5 and 8.4 GHz at pc scales. The overlapped contour images are a VLA image at 1.4 GHz with a uv range 5.1 − 168.7 Kλ, a VLA image at 5 GHz with a uv range 11.3 − 561.2 Kλ, a VLBA image at 1.7 GHz with a uv range 2.3 − 48.0 Mλ, and a VLBA image at 5 GHz with a uv range 5.4 − 39.5 Mλ, respectively. All counters start at 3σrms and increase by a factor of 2. The color represents the value of spectral index α. Pixels with flux density below 5.4σrms, alongside those with spectral index uncertainty exceeding 40%, are blanked.
Current usage metrics show cumulative count of Article Views (full-text article views including HTML views, PDF and ePub downloads, according to the available data) and Abstracts Views on Vision4Press platform.
Data correspond to usage on the plateform after 2015. The current usage metrics is available 48-96 hours after online publication and is updated daily on week days.
Initial download of the metrics may take a while.