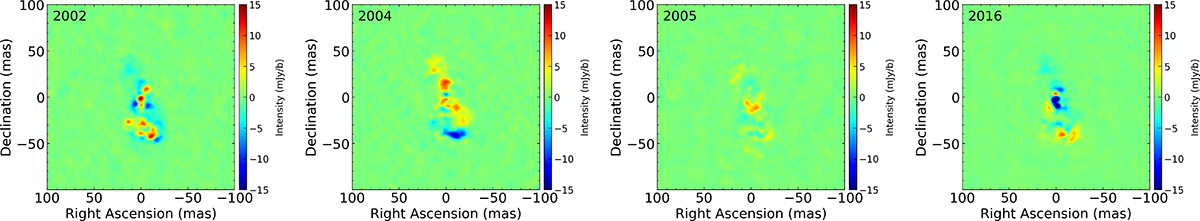
Fig. A.1.
Download original image
Subtraction maps to assess structural changes in 0954+556. The images in Figure 3 were convolved to a common restoring beam, corresponding to the beam from the observation on 13 June 2016. An average image was generated by taking the mean of the four epochs (2002, 2004, 2005, and 2016). Each individual image was then subtracted from the average image to highlight deviations. The color bar represents the intensity in units of mJy/b. The subtraction maps shows the intensity differences range approximately from -15 mJy/b to 15 mJy/b, indicating a stable structure of 0954+556.
Current usage metrics show cumulative count of Article Views (full-text article views including HTML views, PDF and ePub downloads, according to the available data) and Abstracts Views on Vision4Press platform.
Data correspond to usage on the plateform after 2015. The current usage metrics is available 48-96 hours after online publication and is updated daily on week days.
Initial download of the metrics may take a while.