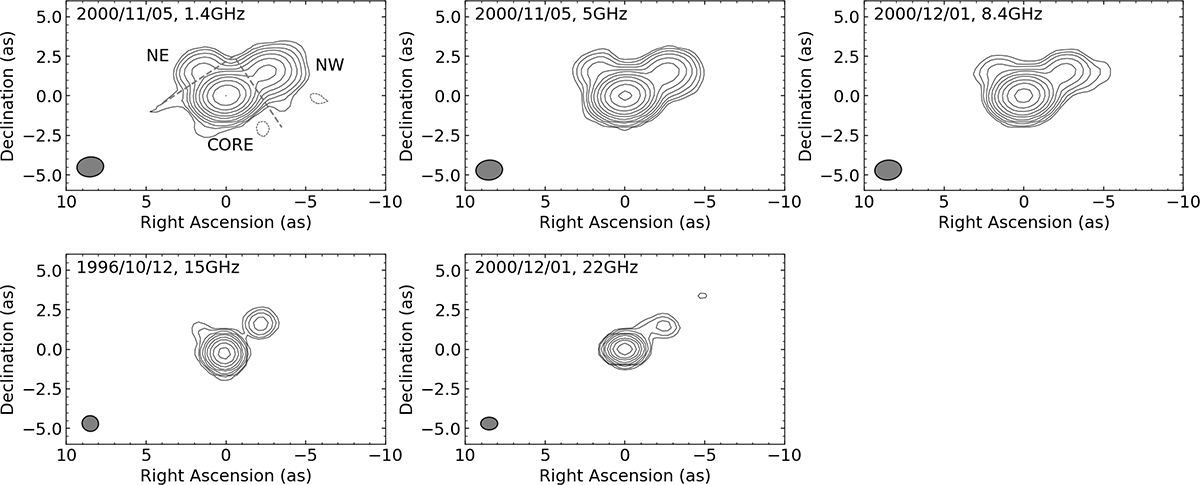
Fig. A.2.
Download original image
Images used when analyzing radiative age at kpc scale. The contours are drawn at -1, 1, 2, 4, 8, ..., of the first contour level (3σrms). The synthesized beams are plotted in the bottom left corner of each image. Three components used in the spectral analysis, i.e., NE, core, and NW, are distinguished by two gray dashed lines.
Current usage metrics show cumulative count of Article Views (full-text article views including HTML views, PDF and ePub downloads, according to the available data) and Abstracts Views on Vision4Press platform.
Data correspond to usage on the plateform after 2015. The current usage metrics is available 48-96 hours after online publication and is updated daily on week days.
Initial download of the metrics may take a while.