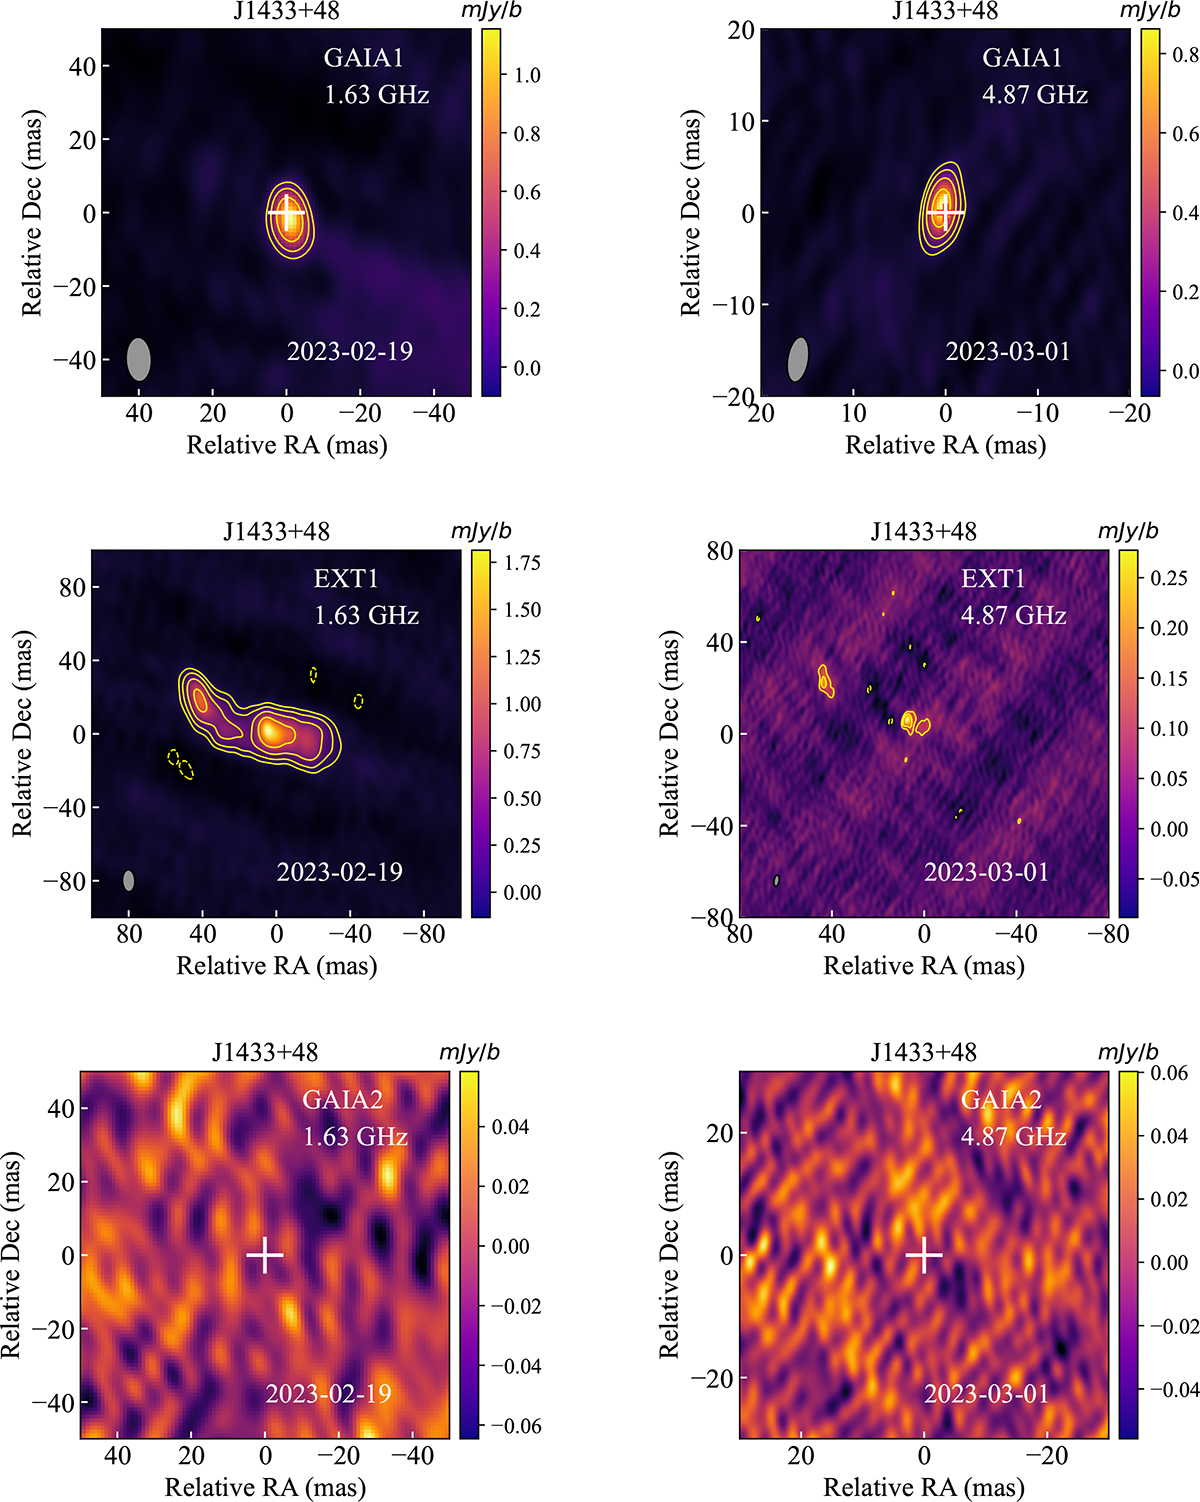
Fig. C.1.
Download original image
Naturally weighted VLBI single-source images of each target position for J1433+4842 at 1.7 and 4.9 GHz. The white crosses in the GAIA1 and GAIA2 images mark the corresponding Gaia positions in each source position. For each CLEANed image, the synthesized beam shape are shown at the bottom left corner. The lowest contours represent 4σ and contour levels increase by a factor of 2. For the GAIA2 images, no significant signal can be detected above 5σ. For this source in the image, 1 mas represents 8.413 pc.
Current usage metrics show cumulative count of Article Views (full-text article views including HTML views, PDF and ePub downloads, according to the available data) and Abstracts Views on Vision4Press platform.
Data correspond to usage on the plateform after 2015. The current usage metrics is available 48-96 hours after online publication and is updated daily on week days.
Initial download of the metrics may take a while.