Fig. 1.
Download original image
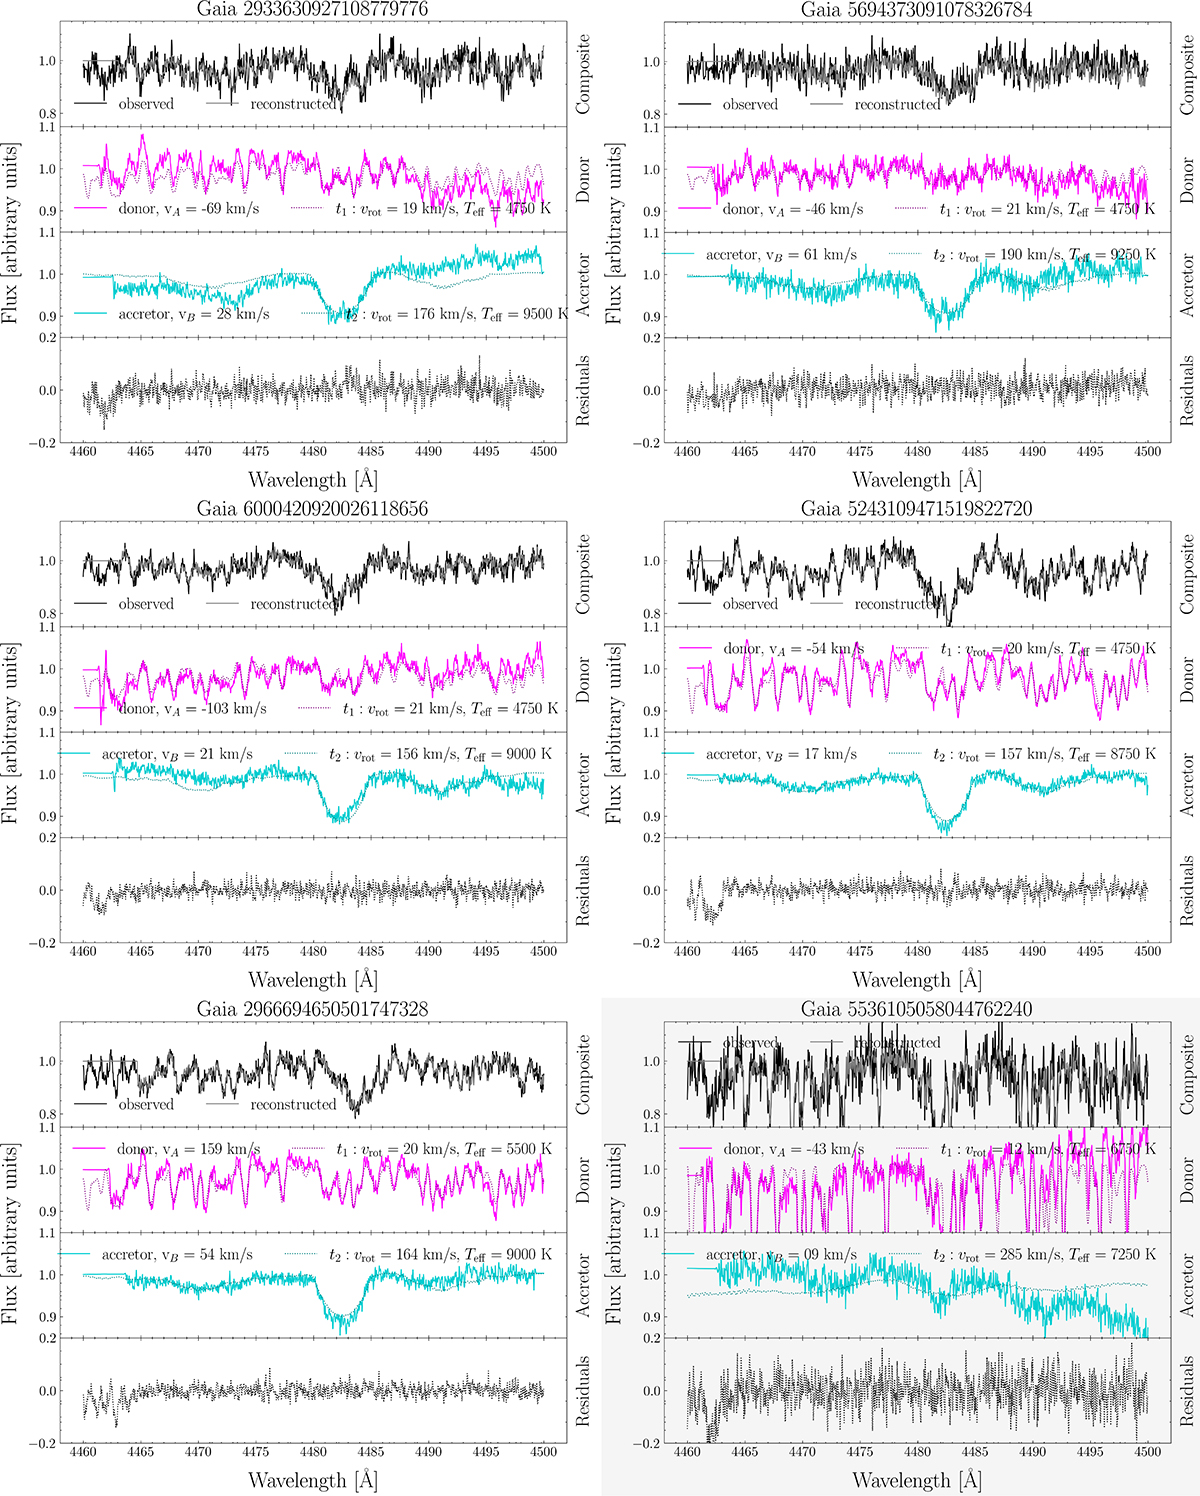
Observed spectra for one epoch (black line, top row), the two disentangled components (magenta and cyan lines, middle row, shown in the rest frame), their sum (grey line, top row, computed by shifting and co-adding), and the residual (bottom row) for the six targets of this study, centered around the Mg II line as seen clearly in the accretor spectrum. We also show the best-fit template spectra for each disentangled component in the middle rows (dotted lines). In this and following figures, plots showing results for target G-5536 have a light grey background to differentiate them from the other targets, due to the difficulties with the analysis encountered for this object.
Current usage metrics show cumulative count of Article Views (full-text article views including HTML views, PDF and ePub downloads, according to the available data) and Abstracts Views on Vision4Press platform.
Data correspond to usage on the plateform after 2015. The current usage metrics is available 48-96 hours after online publication and is updated daily on week days.
Initial download of the metrics may take a while.