Fig. 2.
Download original image
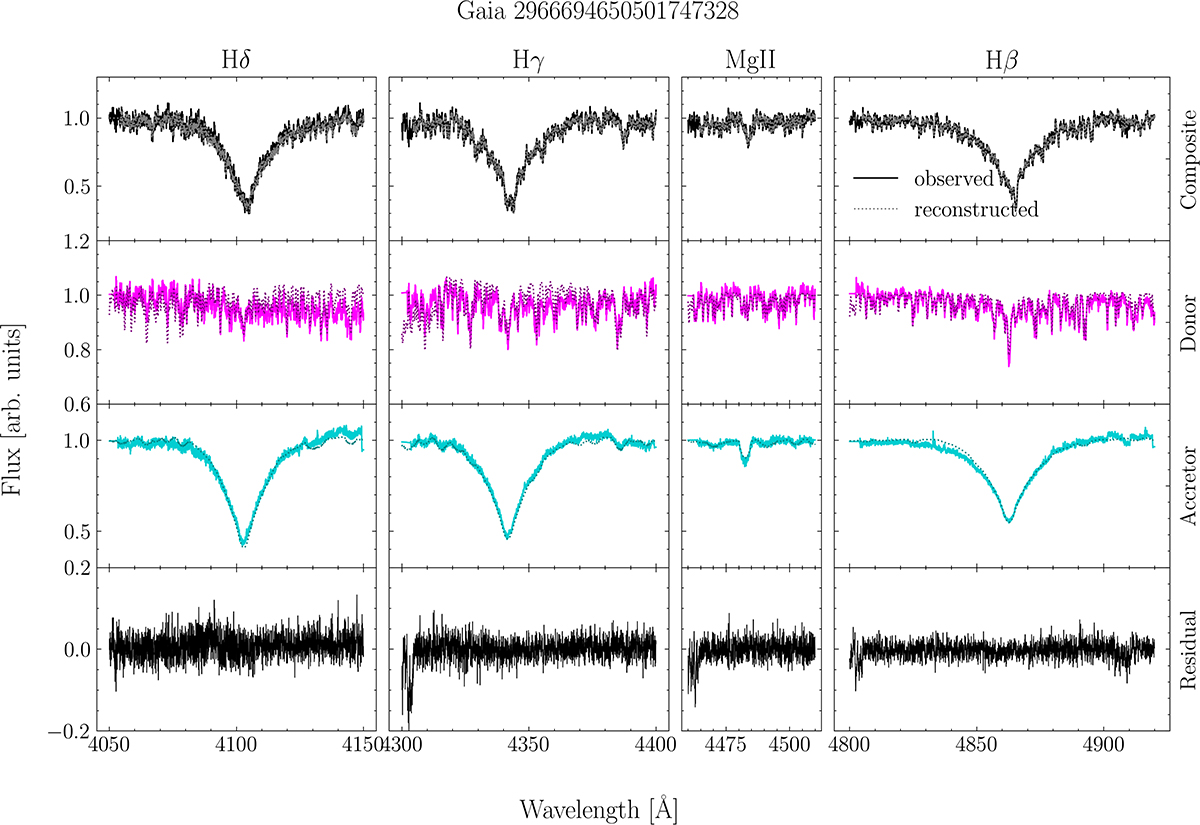
Observed spectra for one epoch (black line, top row), the two disentangled components (magenta and cyan lines, middle rows), their sum (grey line, top row), and the residual (bottom row) for a number of different wavelength ranges. We also show the best-fit template spectra for each disentangled component in the middle rows (dotted lines). The windows here show the Balmer series and Mg II in the accretor, which is hot and has few lines. Here, we only show the spectra for one object (G-2966), the rest can be found in Figures A.1 and A.2.
Current usage metrics show cumulative count of Article Views (full-text article views including HTML views, PDF and ePub downloads, according to the available data) and Abstracts Views on Vision4Press platform.
Data correspond to usage on the plateform after 2015. The current usage metrics is available 48-96 hours after online publication and is updated daily on week days.
Initial download of the metrics may take a while.