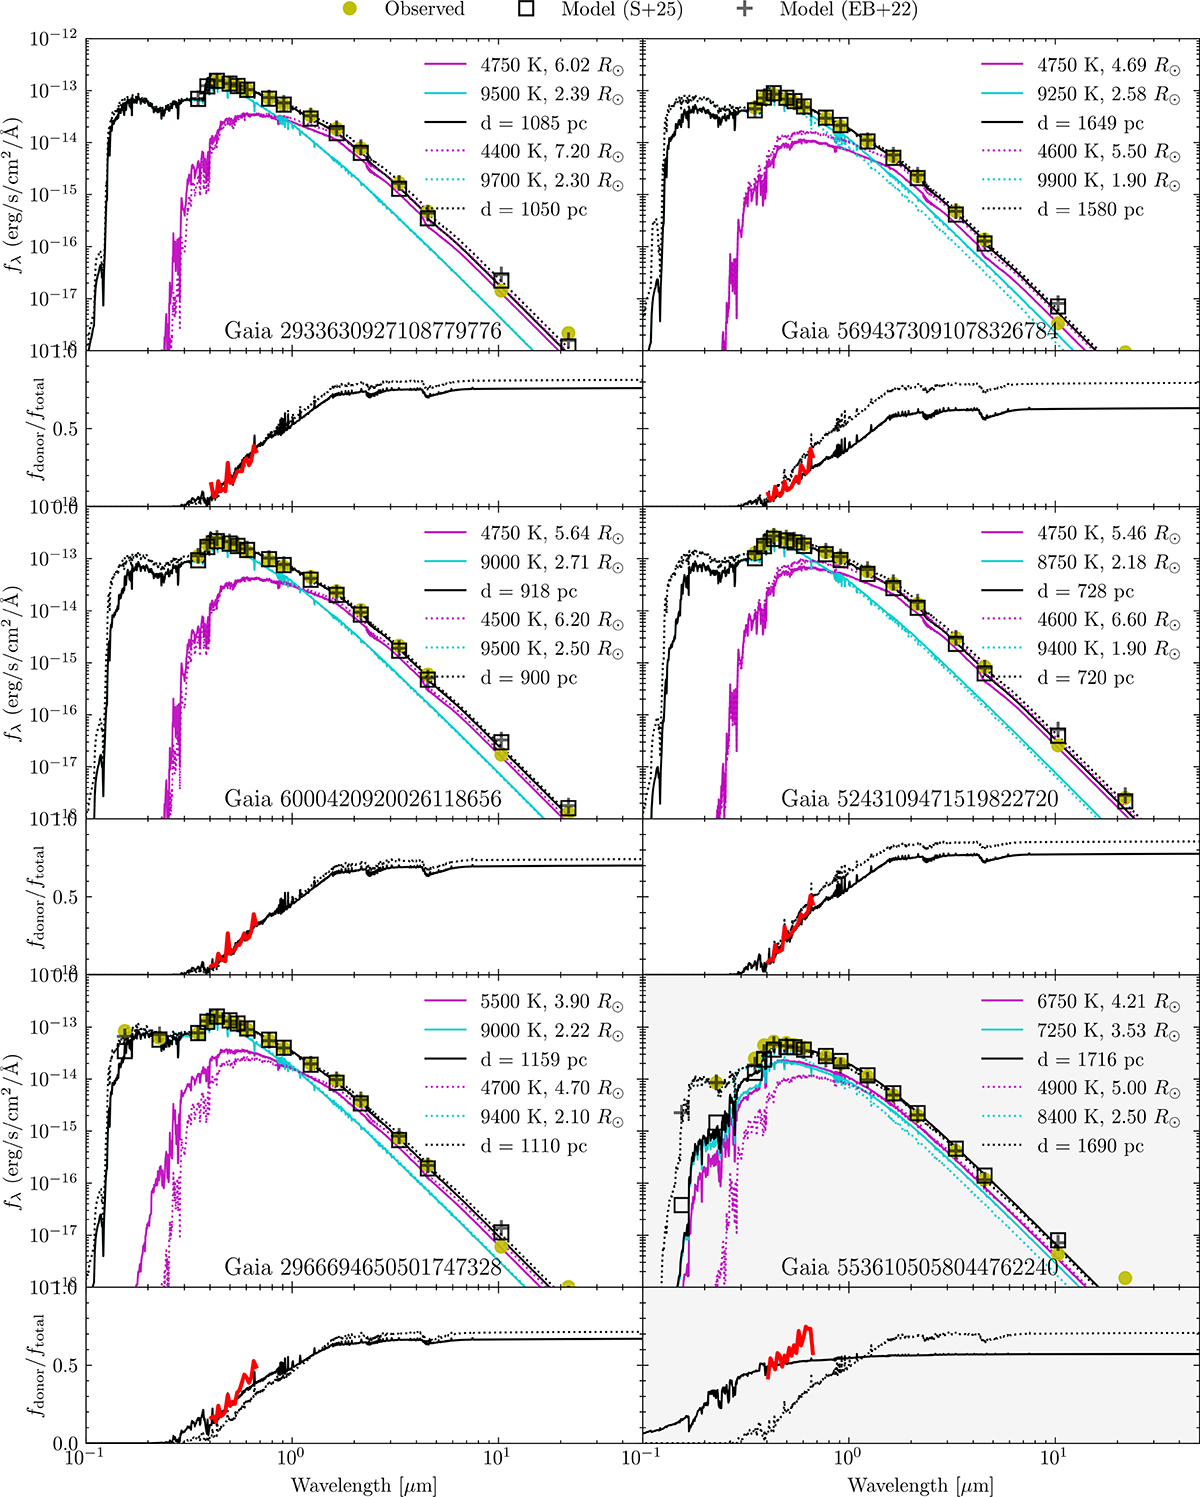
Fig. 4.
Download original image
Spectral energy distribution fits and light ratio as a function of wavelength for each target. In the top plot of each set, we see the donor’s (magenta line) and accretor’s (cyan line) model SED, as well as sum of the two component models (black line). Solid lines use stellar parameters from this work, and dotted lines the parameters derived in EB+22. We also overplot the observed photometry (lime dots), as well as the mock photometry from this work (black squares) and EB+22 (grey crosses). Section 3.5 describes how each of these were obtained/computed. The bottom panel shows the contribution of the donor to the total flux as a function of wavelength. Again, solid indicates this work, dotted EB+22. The red line shows the spectroscopic light ratio derived in this work, providing an additional constraint in the SED fitting process. Target G-5536 is shown with a grey background to highlight the difficutlies with its analysis.
Current usage metrics show cumulative count of Article Views (full-text article views including HTML views, PDF and ePub downloads, according to the available data) and Abstracts Views on Vision4Press platform.
Data correspond to usage on the plateform after 2015. The current usage metrics is available 48-96 hours after online publication and is updated daily on week days.
Initial download of the metrics may take a while.