Fig. 5.
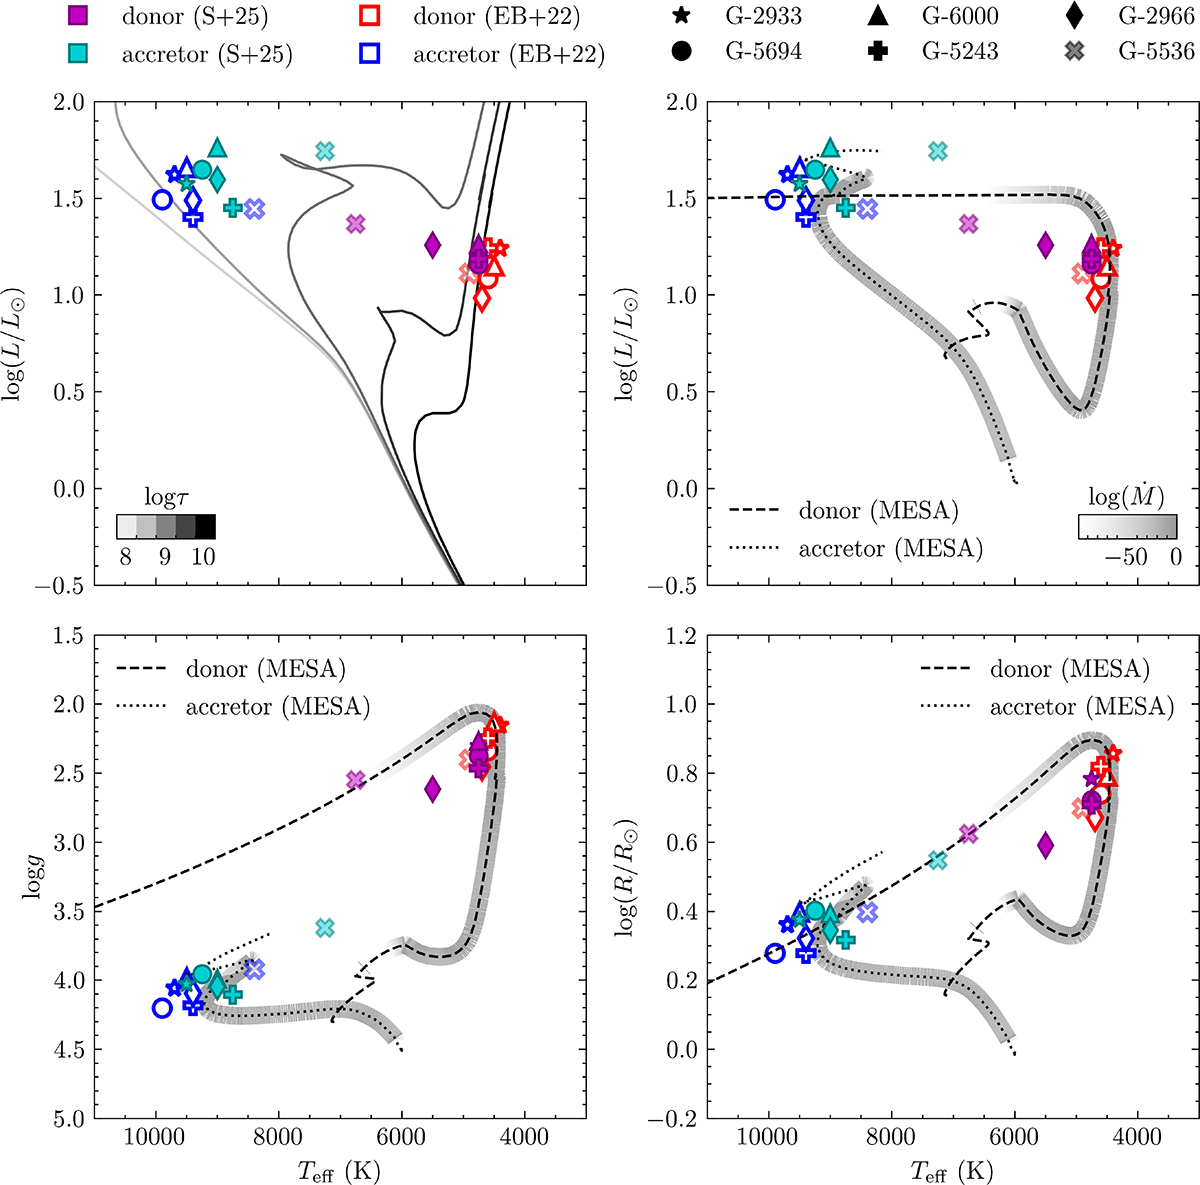
Download original image
Parameters of both components of each system as determined in this work (S+25) and EB+22. Findings from S+25 are shown with filled symbols in magenta (donor) and cyan (accretor), while those from EB+22 are empty, outlined in red (donor) and blue (accretor). Different symbols have been chosen to represent the six different systems, with the problematic system (G-5536) shown as more transparent than the rest. The top left panel shows a Hertzsprung-Russel diagram, including PARSEC isochrones spanning a range of ages (Bressan et al. 2012). The top right panel shows the same parameter space, but with possible MESA evolutionary paths for the donor (dashed line) and accretor (dotted line) included, as computed by EB+22. The bottom two panels show log g vs. Teff and log R vs Teff respectively, as well as including the aforementioned MESA tracks. The grey shading behind each line indicates the amount of mass transfer in the MESA model at that evolutionary stage.
Current usage metrics show cumulative count of Article Views (full-text article views including HTML views, PDF and ePub downloads, according to the available data) and Abstracts Views on Vision4Press platform.
Data correspond to usage on the plateform after 2015. The current usage metrics is available 48-96 hours after online publication and is updated daily on week days.
Initial download of the metrics may take a while.