Fig. 5
Download original image
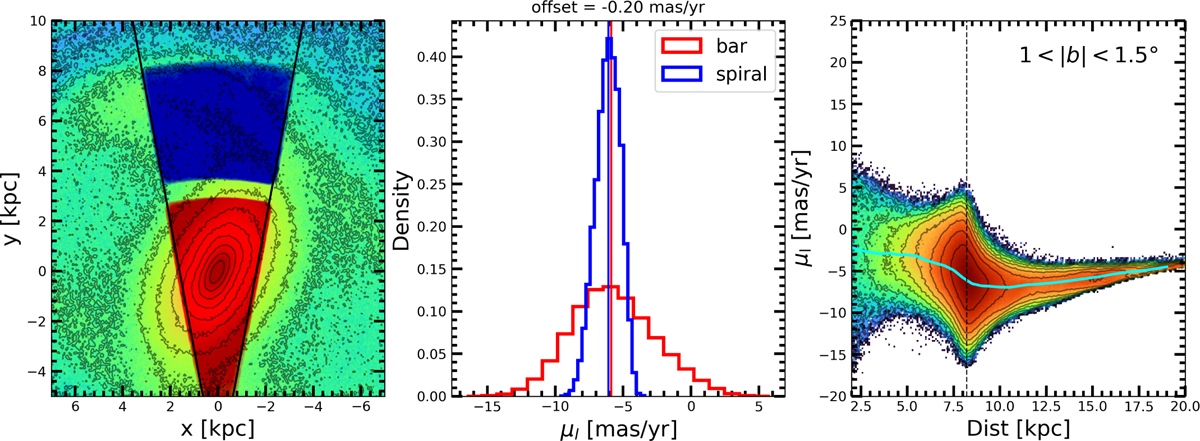
Left panel: density distribution of stars used in the simulation analysis. The stars analogous to RC1 in red (3 < d < 11 kpc) and those to RC2 are shown in blue (12 < d < 16.5 kpc). They lie within 1 deg < |b| < 1.5 deg. Middle panel: μl* distribution for RC1 and RC2 with the median marked with solid lines. Right panel: stellar density distribution in μl*–d space. The dashed black line shows the centre of the model, while the cyan curve represents the median μl* in each distance bin.
Current usage metrics show cumulative count of Article Views (full-text article views including HTML views, PDF and ePub downloads, according to the available data) and Abstracts Views on Vision4Press platform.
Data correspond to usage on the plateform after 2015. The current usage metrics is available 48-96 hours after online publication and is updated daily on week days.
Initial download of the metrics may take a while.