Fig. 7
Download original image
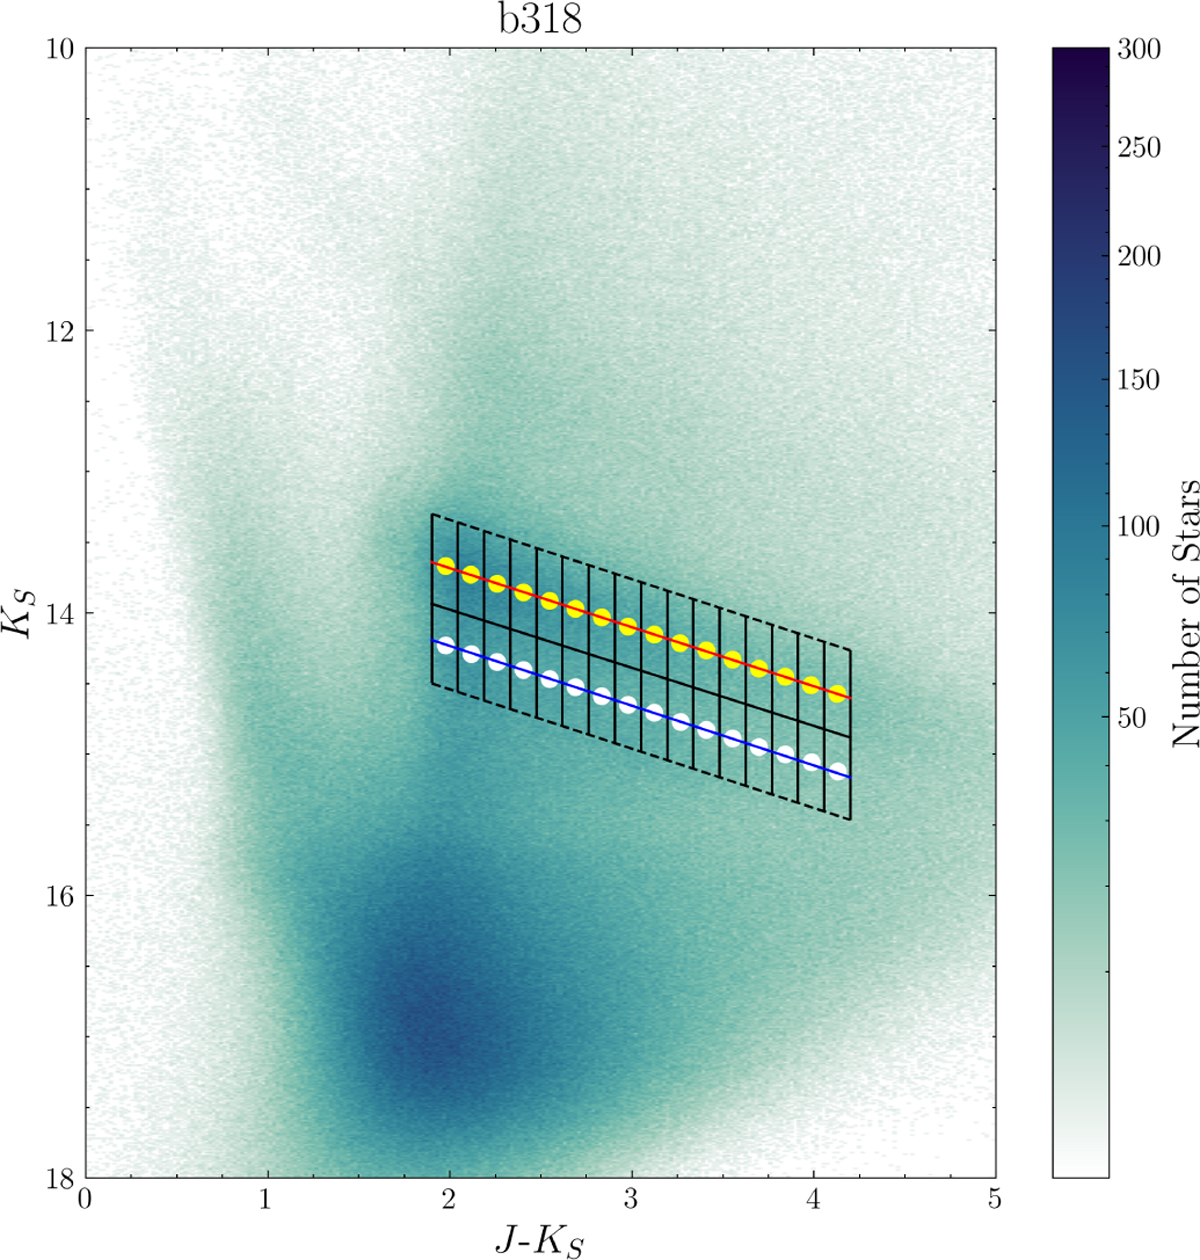
CMD Ks vs J − Ks for the b118 tile, illustrating the slope determination for RC1 and RC2. The black parallelogram outlines the selection box for the RC stars, with divisions indicating the colour cuts used for the GMM analysis. Yellow and white points represent the mean values of the Gaussian models for RC1 and RC2, respectively. The red and blue lines show the fitted linear trends for each feature, from which the slopes are derived. The colour bar represents stellar density in the diagram.
Current usage metrics show cumulative count of Article Views (full-text article views including HTML views, PDF and ePub downloads, according to the available data) and Abstracts Views on Vision4Press platform.
Data correspond to usage on the plateform after 2015. The current usage metrics is available 48-96 hours after online publication and is updated daily on week days.
Initial download of the metrics may take a while.