Fig. 9
Download original image
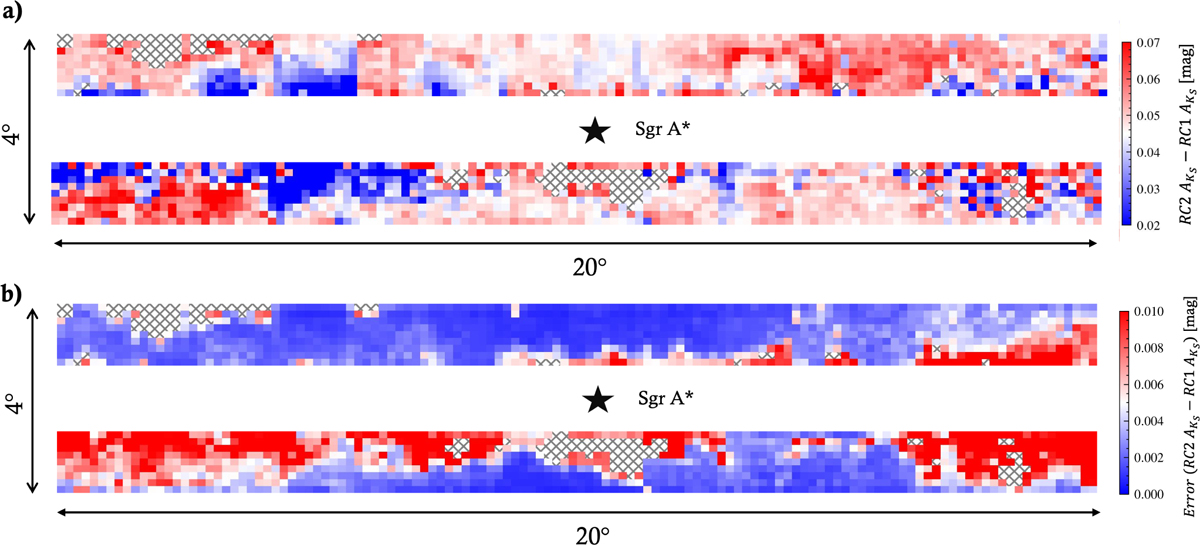
Extinction difference map obtained by subtracting the extinction map of RC1 from that of RC2 (top panel), along with the corresponding uncertainty map (bottom panel). The colour bars indicate the extinction values for each pixel and their associated uncertainties. Empty pixels correspond to regions with an insufficient number of stars to compute a value. The position of the supermassive black hole, Sgr A*, is marked with a black star in each panel, and the map sizes are indicated.
Current usage metrics show cumulative count of Article Views (full-text article views including HTML views, PDF and ePub downloads, according to the available data) and Abstracts Views on Vision4Press platform.
Data correspond to usage on the plateform after 2015. The current usage metrics is available 48-96 hours after online publication and is updated daily on week days.
Initial download of the metrics may take a while.