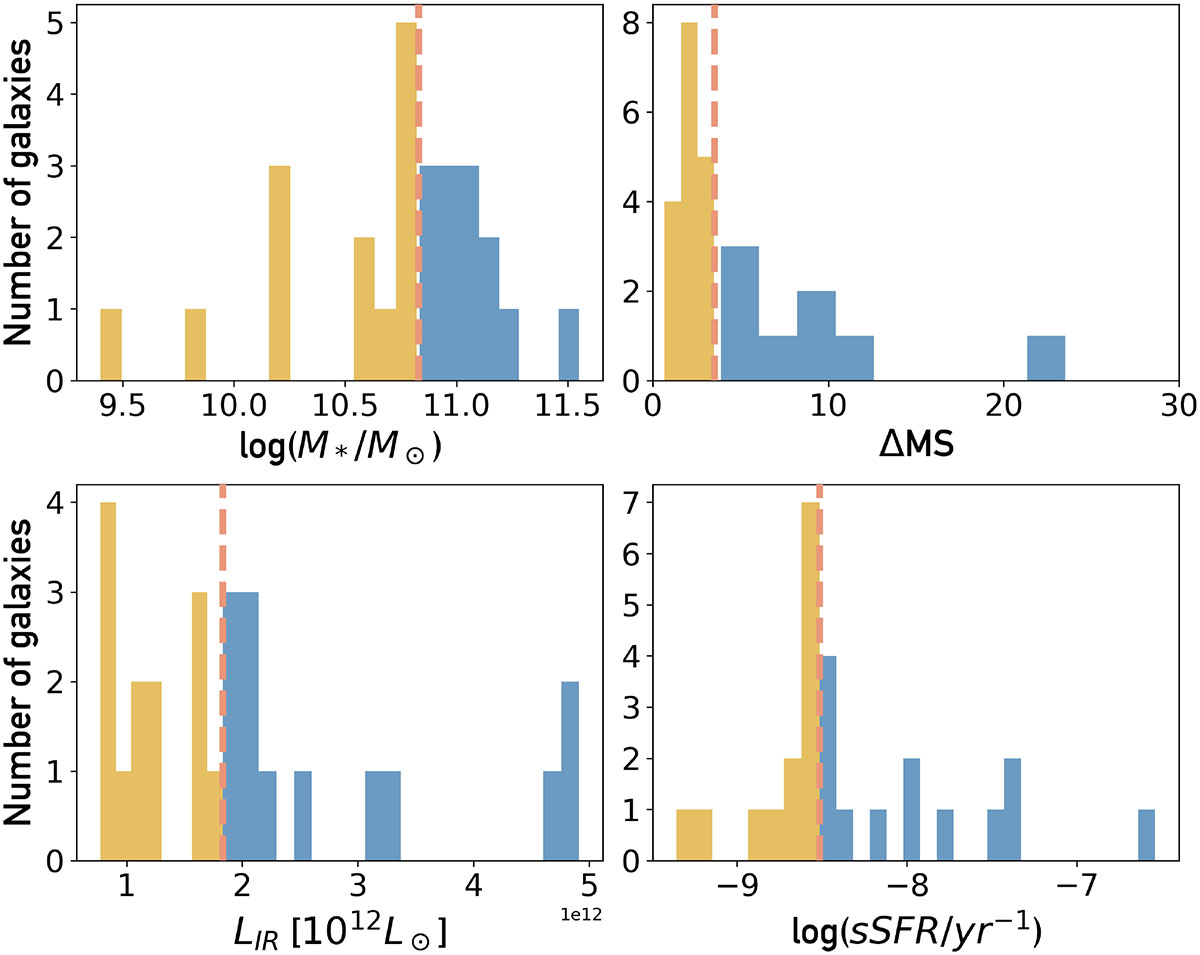
Fig. 1.
Download original image
Distributions of properties of sample used in this study. Galaxies with values below (above) the median are marked in yellow (blue). The median value is shown with the dashed vertical line, except for the distance to the MS for which we show a cut 3.5 times higher than (below) the MS. Top left: Stellar mass, M★. Top right: Distance to MS as reported in Valentino et al. (2020). Bottom left: Infrared luminosity, LIR. Bottom right: Specific star formation rate (sSFR).
Current usage metrics show cumulative count of Article Views (full-text article views including HTML views, PDF and ePub downloads, according to the available data) and Abstracts Views on Vision4Press platform.
Data correspond to usage on the plateform after 2015. The current usage metrics is available 48-96 hours after online publication and is updated daily on week days.
Initial download of the metrics may take a while.