Fig. A.1.
Download original image
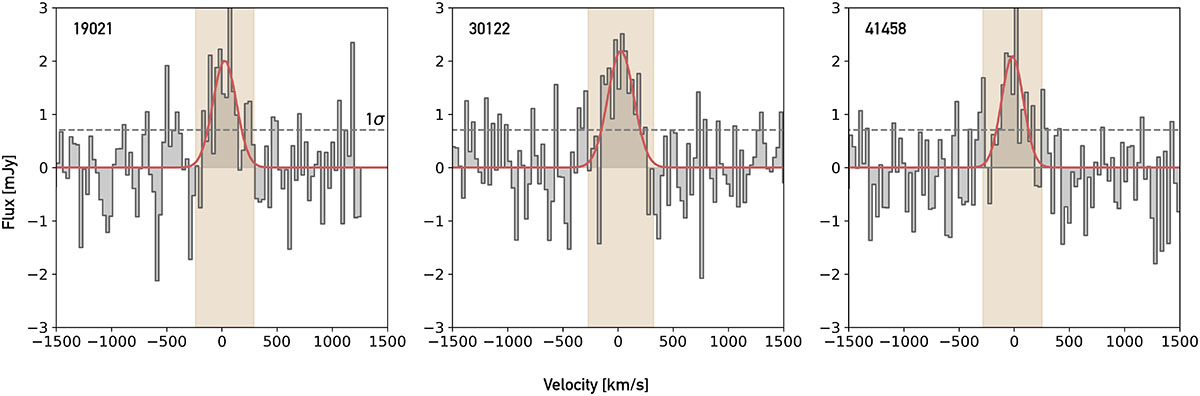
Examples of spectra (grey) and the median Gaussian fit (red solid line) used to image the intensity maps in Sect. 3.1. The channels used to create the intensity maps (i.e., FWHM ± σFWHM of the median Gaussian fit) are highlighted with the light-brown shaded area. The horizontal dashed line shows the 1σ noise level of the spectrum.
Current usage metrics show cumulative count of Article Views (full-text article views including HTML views, PDF and ePub downloads, according to the available data) and Abstracts Views on Vision4Press platform.
Data correspond to usage on the plateform after 2015. The current usage metrics is available 48-96 hours after online publication and is updated daily on week days.
Initial download of the metrics may take a while.