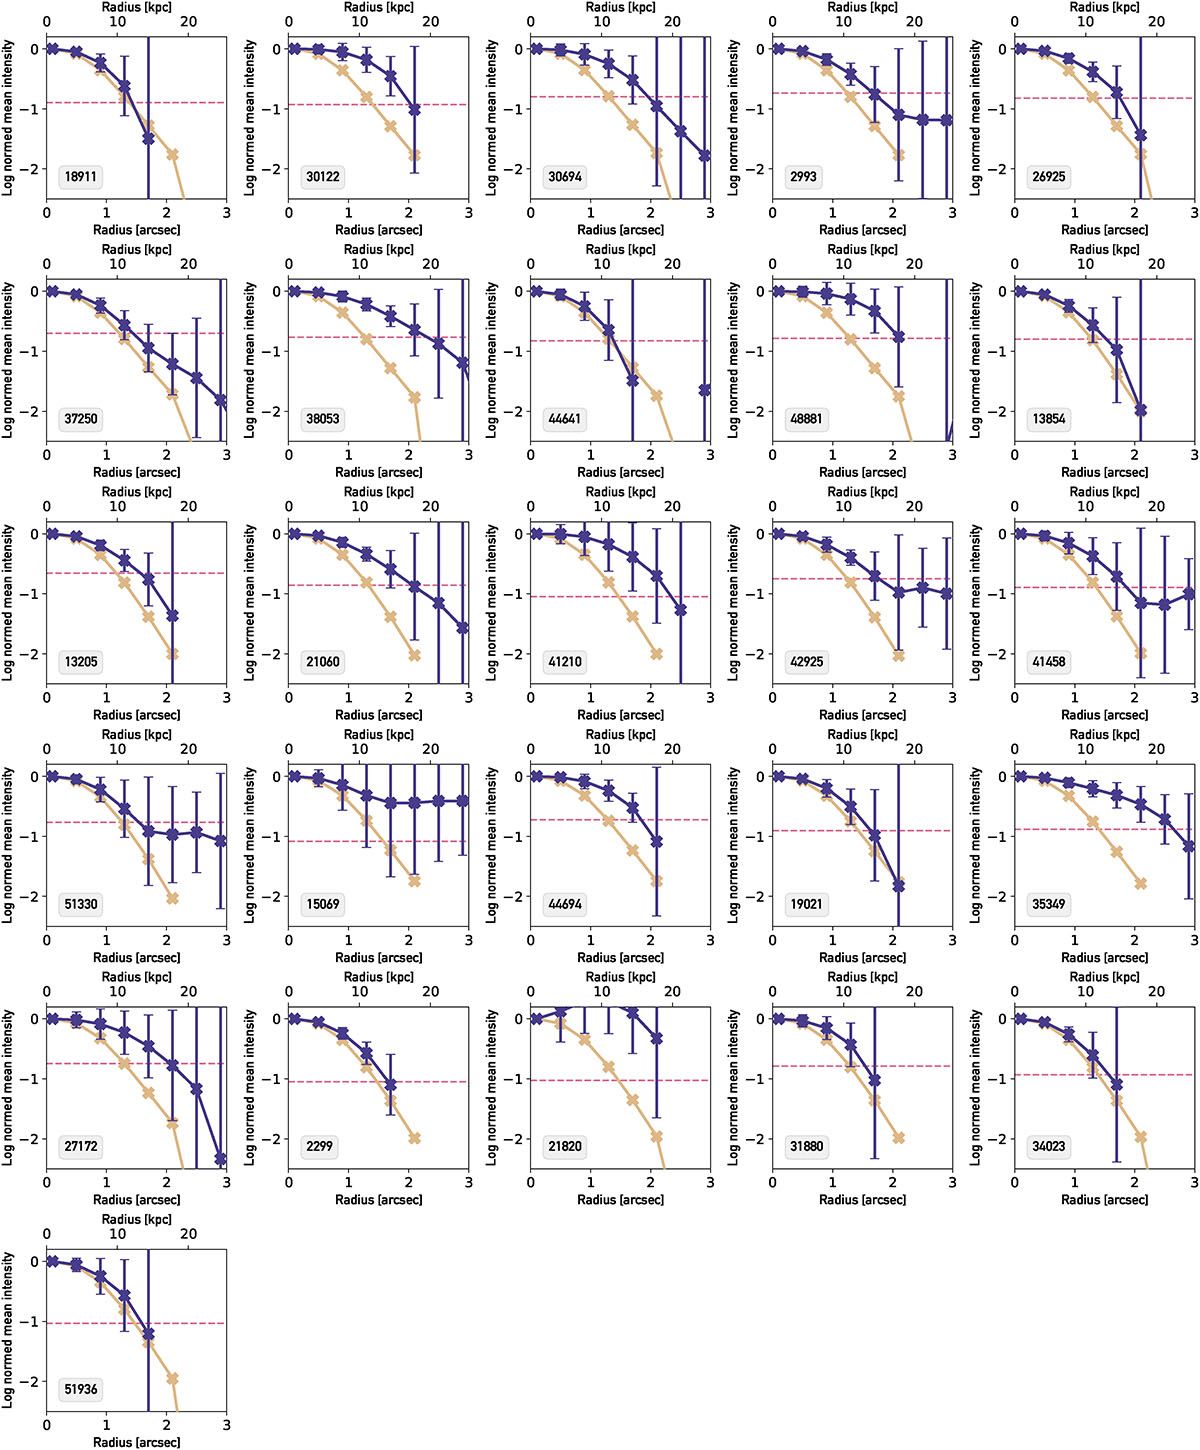
Fig. A.3.
Download original image
Stamps showing the surface brightness radial profile of each galaxy in our sample. The galaxy ID number is shown at the bottom left corner of each stamp. The colour-code is the same as in the main text, i.e. the horizontal pink dashed-line shows the 1σ standard deviation level of the map, the beige solid line shows the radial profile of the synthesised beam and the purple solid line shows the radial profile of the CO(2–1) emission.
Current usage metrics show cumulative count of Article Views (full-text article views including HTML views, PDF and ePub downloads, according to the available data) and Abstracts Views on Vision4Press platform.
Data correspond to usage on the plateform after 2015. The current usage metrics is available 48-96 hours after online publication and is updated daily on week days.
Initial download of the metrics may take a while.