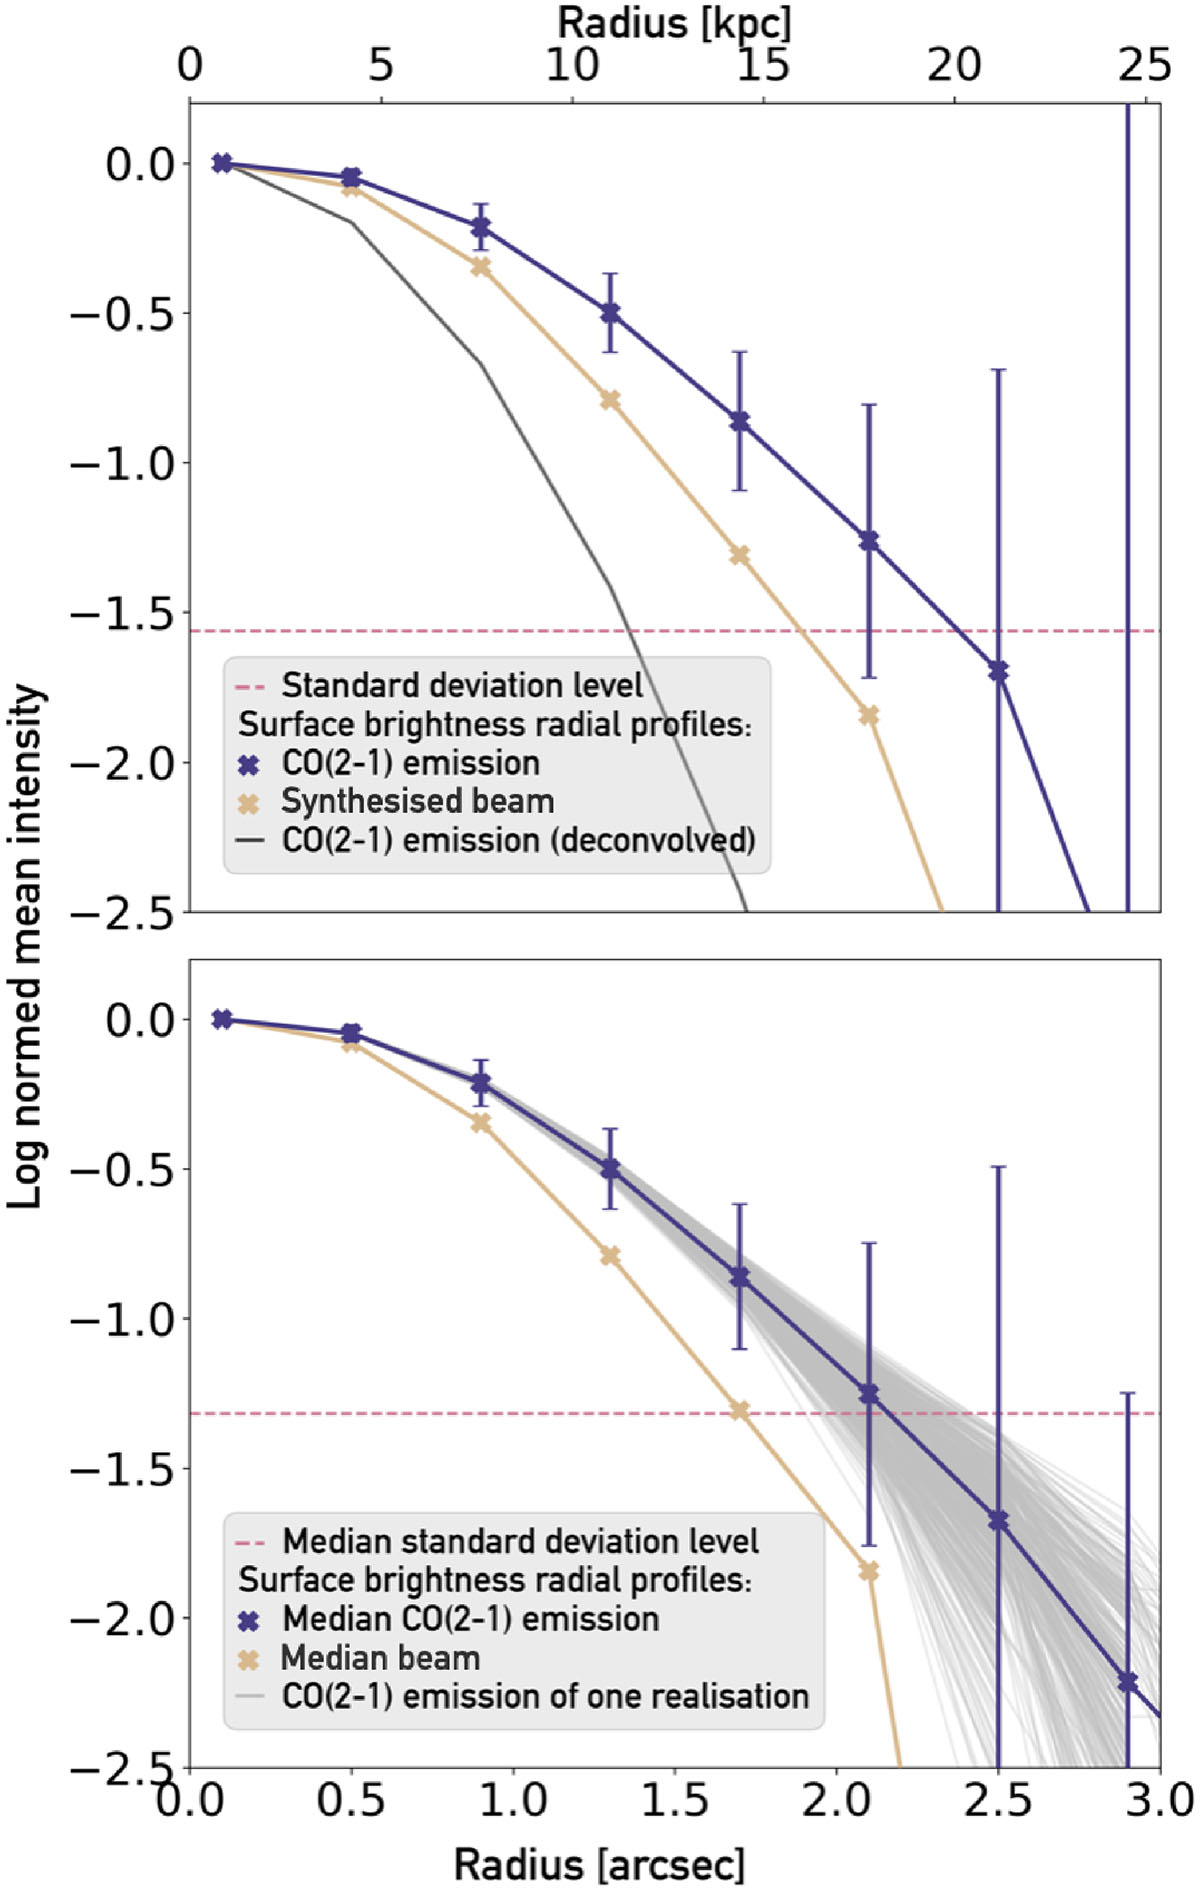
Fig. 3.
Download original image
Surface-brightness radial profiles of CO(2–1) emission (in purple) and the synthesised beam (in beige) of the uniform stacked CO(2–1) intensity map. The dashed pink line shows the noise level of the map. The upper panel shows the profiles of the entire sample of 26 galaxies, and the intrinsic CO(2–1) emission (black line). The bottom panel shows the profiles of 500 resampling iterations by randomly removing 30% of the sample (grey lines) and the median of these iterations (purple line). The error bars show the median of the uncertainty associated with each iteration within each annulus and the horizontal dashed pink line shows the median standard deviation of the 500 resampled intensity maps.
Current usage metrics show cumulative count of Article Views (full-text article views including HTML views, PDF and ePub downloads, according to the available data) and Abstracts Views on Vision4Press platform.
Data correspond to usage on the plateform after 2015. The current usage metrics is available 48-96 hours after online publication and is updated daily on week days.
Initial download of the metrics may take a while.