Fig. 4.
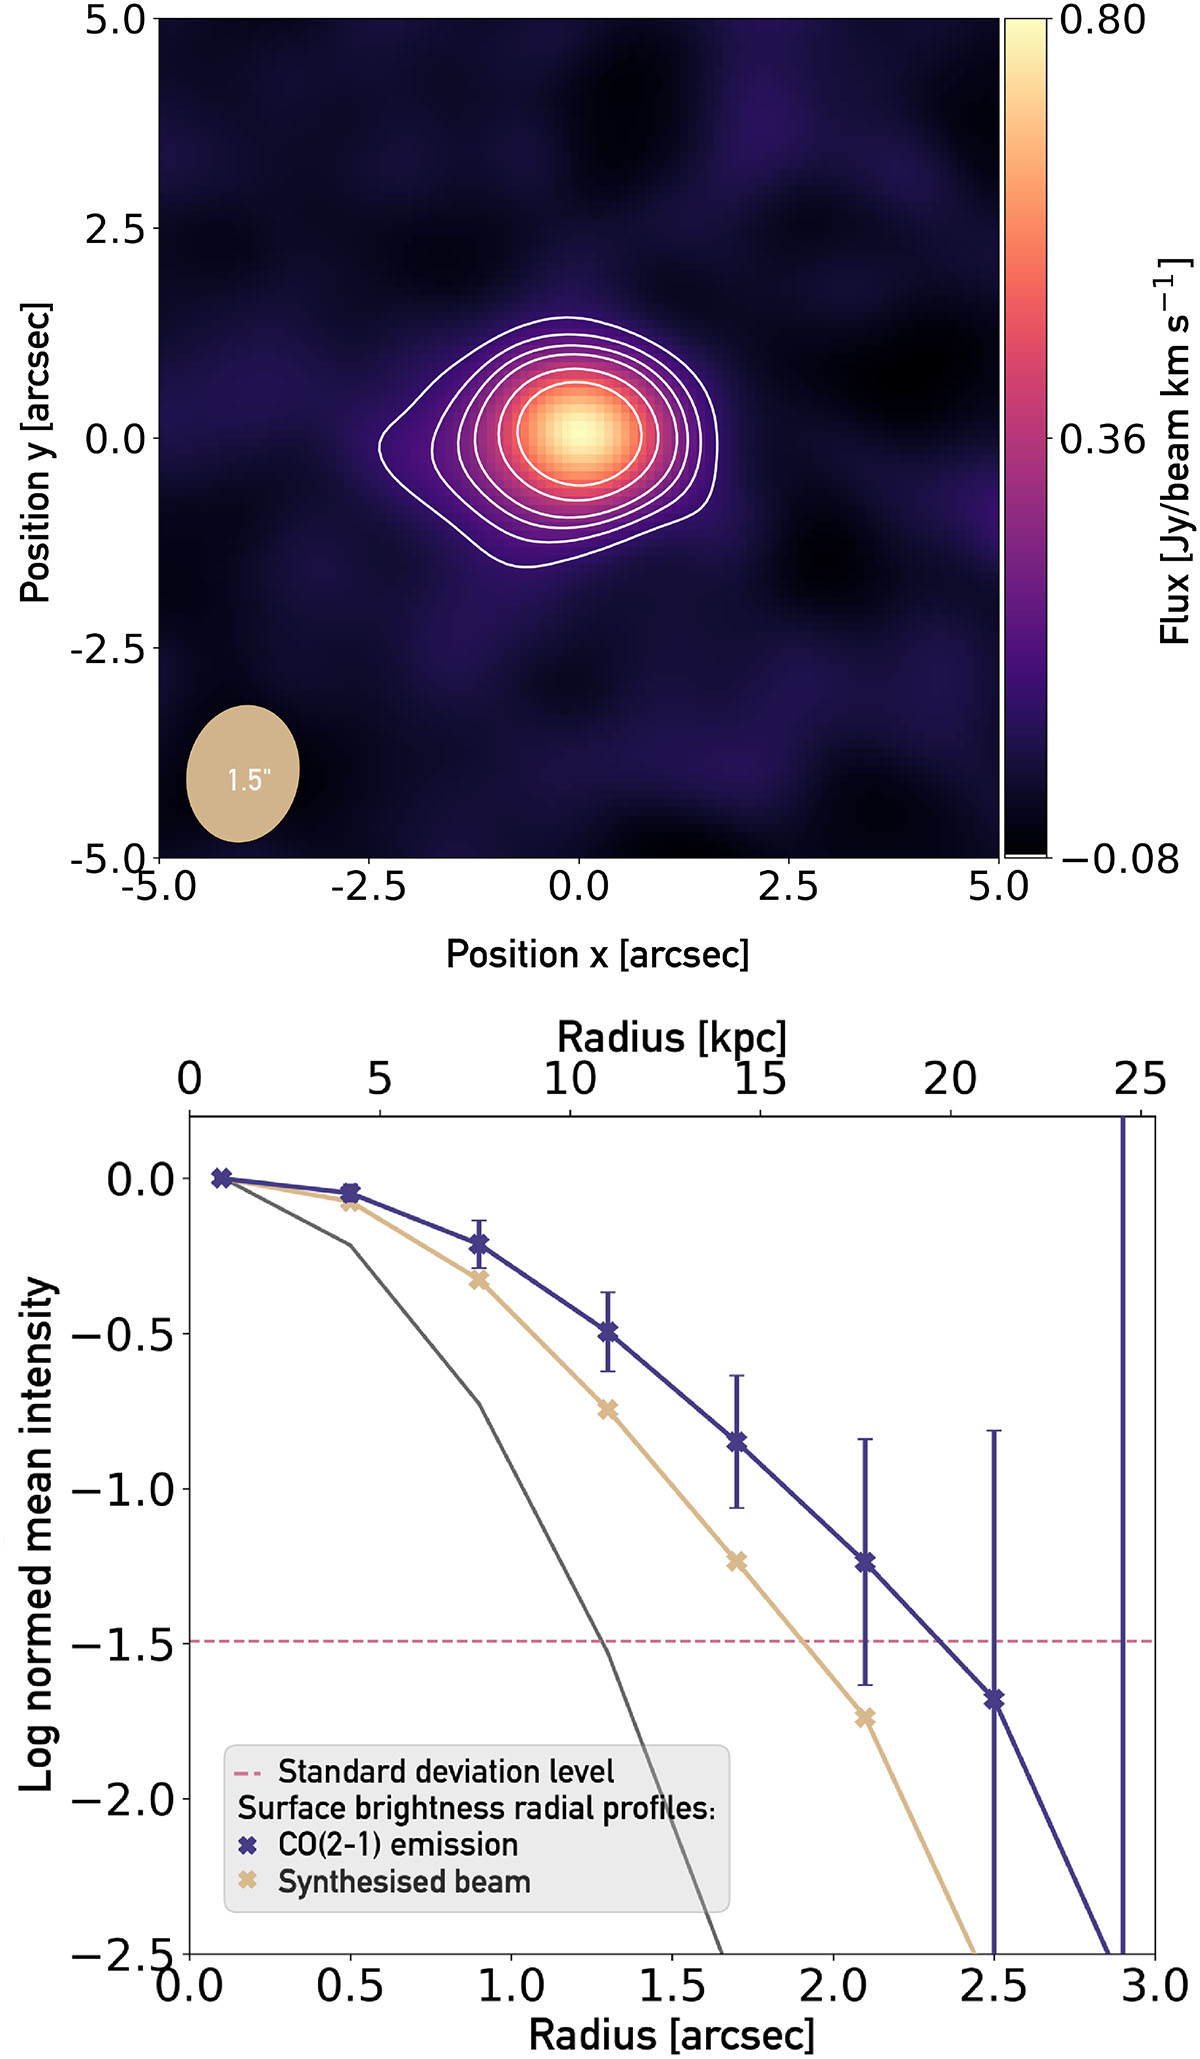
Download original image
Top panel: CO(2–1) intensity map resulting from stacked cube (uniformly weighted). The beam is shown in the bottom left corner. Bottom panel: Surface-brightness radial profiles of the CO(2–1) emission (in purple), the synthesised beam (in beige) of the CO(2–1) intensity map imaged from the uniformly stacked cubes, and the intrinsic CO(2–1) emission (in black).
Current usage metrics show cumulative count of Article Views (full-text article views including HTML views, PDF and ePub downloads, according to the available data) and Abstracts Views on Vision4Press platform.
Data correspond to usage on the plateform after 2015. The current usage metrics is available 48-96 hours after online publication and is updated daily on week days.
Initial download of the metrics may take a while.