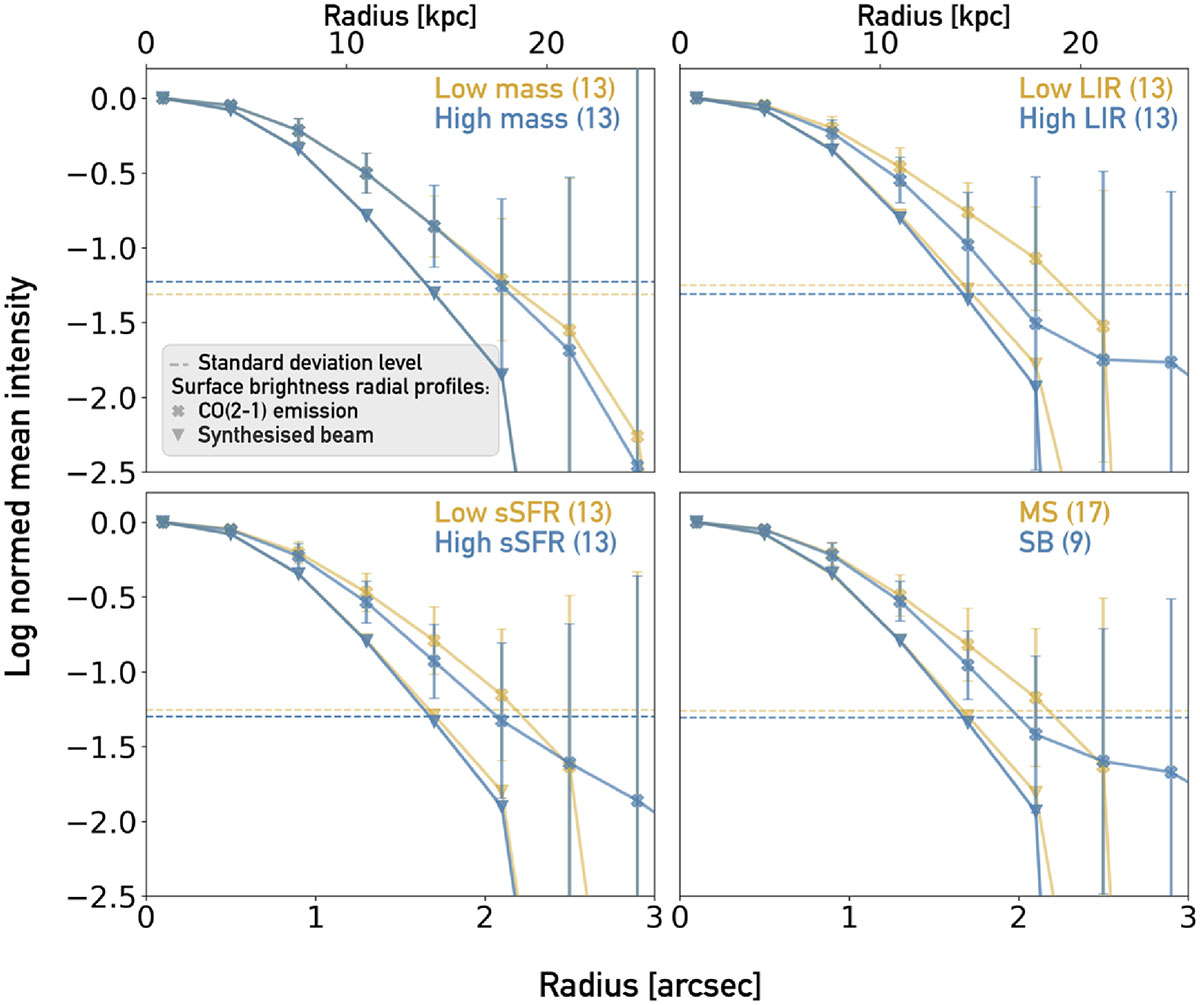
Fig. 5.
Download original image
Surface-brightness radial profiles of CO(2–1) emission and corresponding synthesised beam in different galaxy property bins. The number of galaxies in each bin is shown in parentheses. Low (MS) bins are shown in yellow, and high (SB) bins are shown in blue. Top left: Stellar-mass bin, where low mass is ≤1010.83 M⊙ and high mass is > 1010.83 M⊙. Top right: Infrared-luminosity bin, with low LIR ≤ 1012.26 L⊙ and high LIR > 1012.26 L⊙. Bottom left: sSFR bin, with (log) low sSFR ≤ −8.5 yr−1 and (log) high sSFR > −8.5 yr−1. Bottom right: Distance to the MS, where MS ≤ 3.5 times corresponds to galaxies within the scatter of the MS, and SB > 3.5 times corresponds to galaxies above.
Current usage metrics show cumulative count of Article Views (full-text article views including HTML views, PDF and ePub downloads, according to the available data) and Abstracts Views on Vision4Press platform.
Data correspond to usage on the plateform after 2015. The current usage metrics is available 48-96 hours after online publication and is updated daily on week days.
Initial download of the metrics may take a while.