Fig. 6.
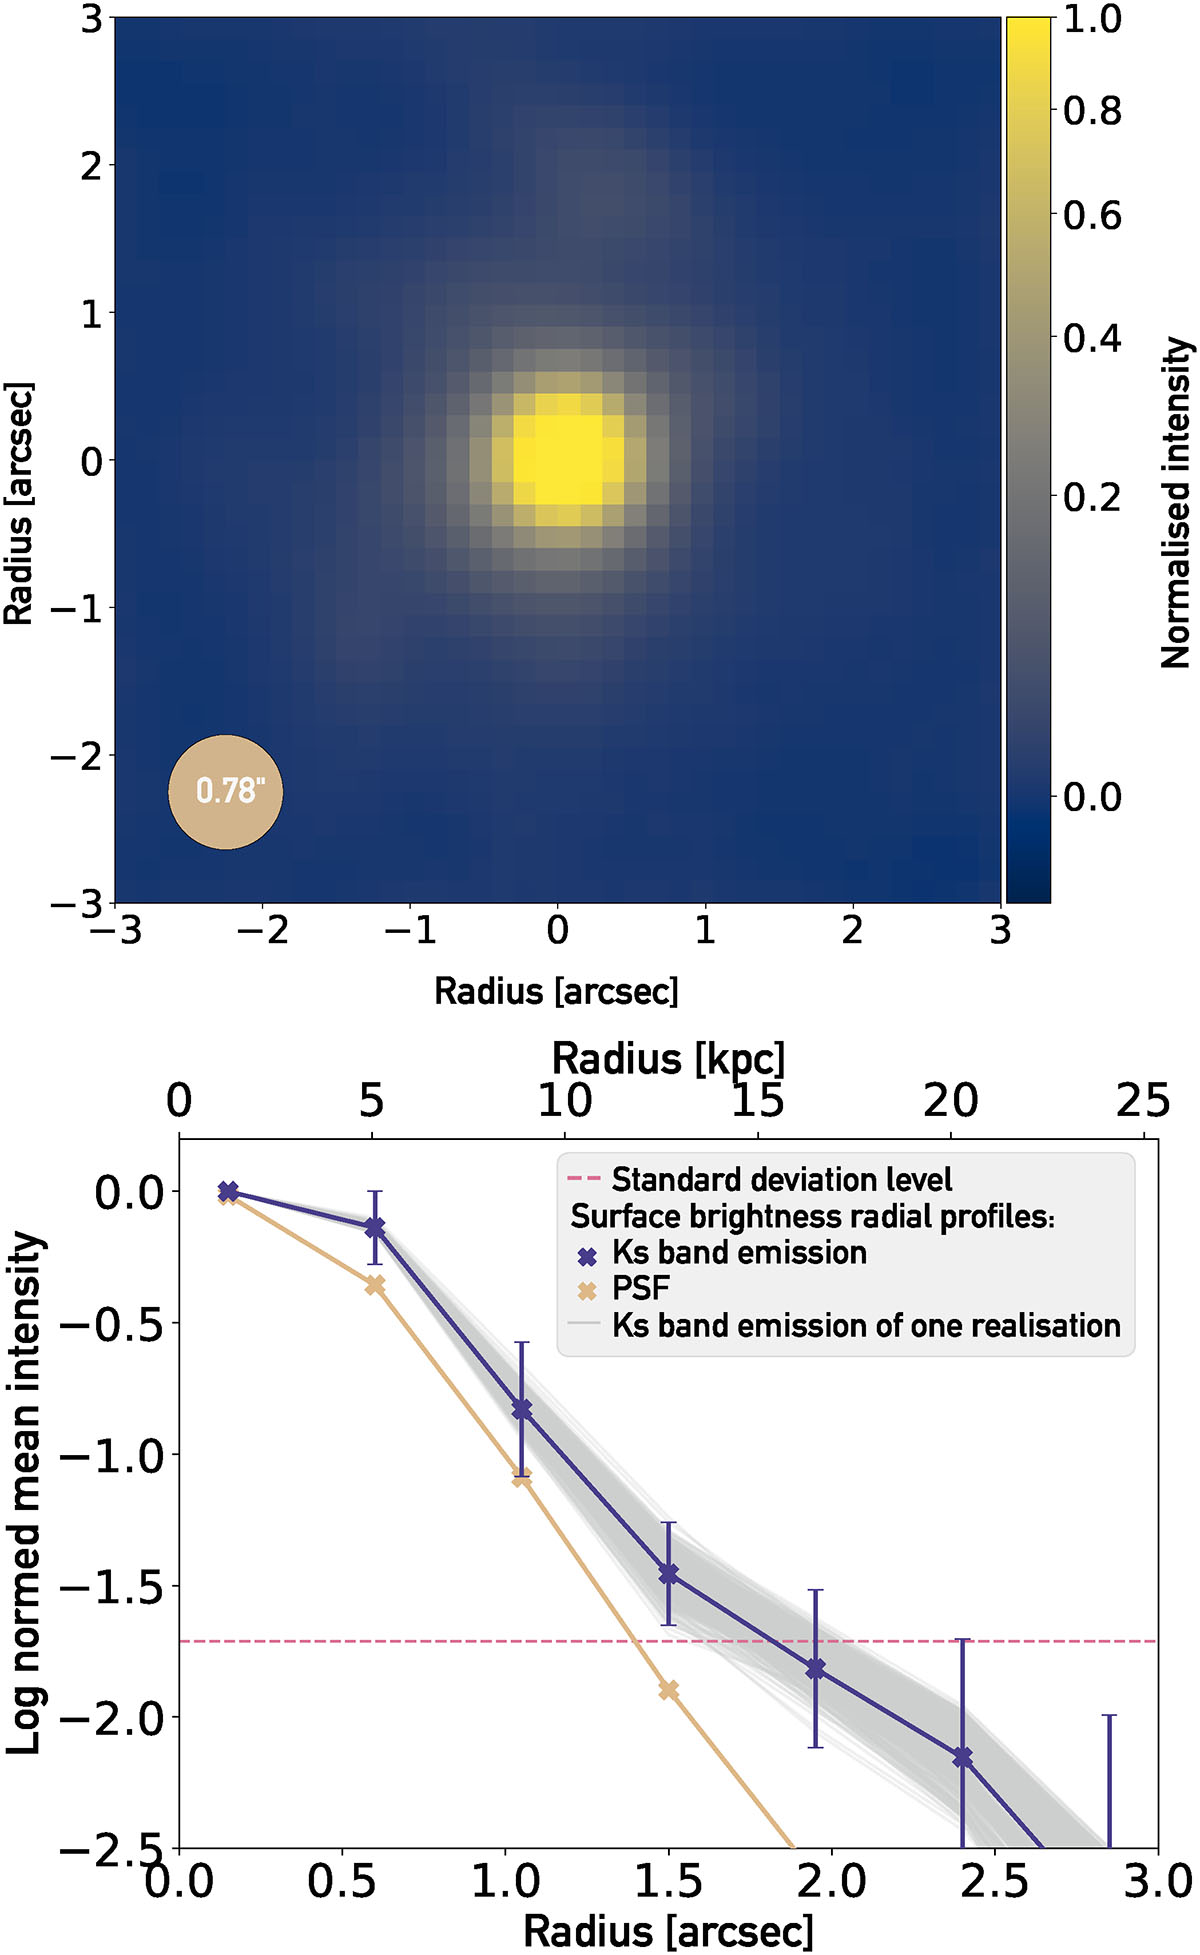
Download original image
Top panel: Stacked Ks-band PSF-deconvolved and background subtracted image. The diameter of the beige circle in the bottom left corner corresponds to the FWHM of the PSF. Bottom panel: Surface-brightness radial profiles of deconvolved, stacked Ks-band emission (in purple), the corresponding PSF (in beige), and the 3σ noise level of the stacked image (horizontal dashed pink line). The surface-brightness radial profile of each deconvolved and resampled stack is shown with thin grey lines.
Current usage metrics show cumulative count of Article Views (full-text article views including HTML views, PDF and ePub downloads, according to the available data) and Abstracts Views on Vision4Press platform.
Data correspond to usage on the plateform after 2015. The current usage metrics is available 48-96 hours after online publication and is updated daily on week days.
Initial download of the metrics may take a while.