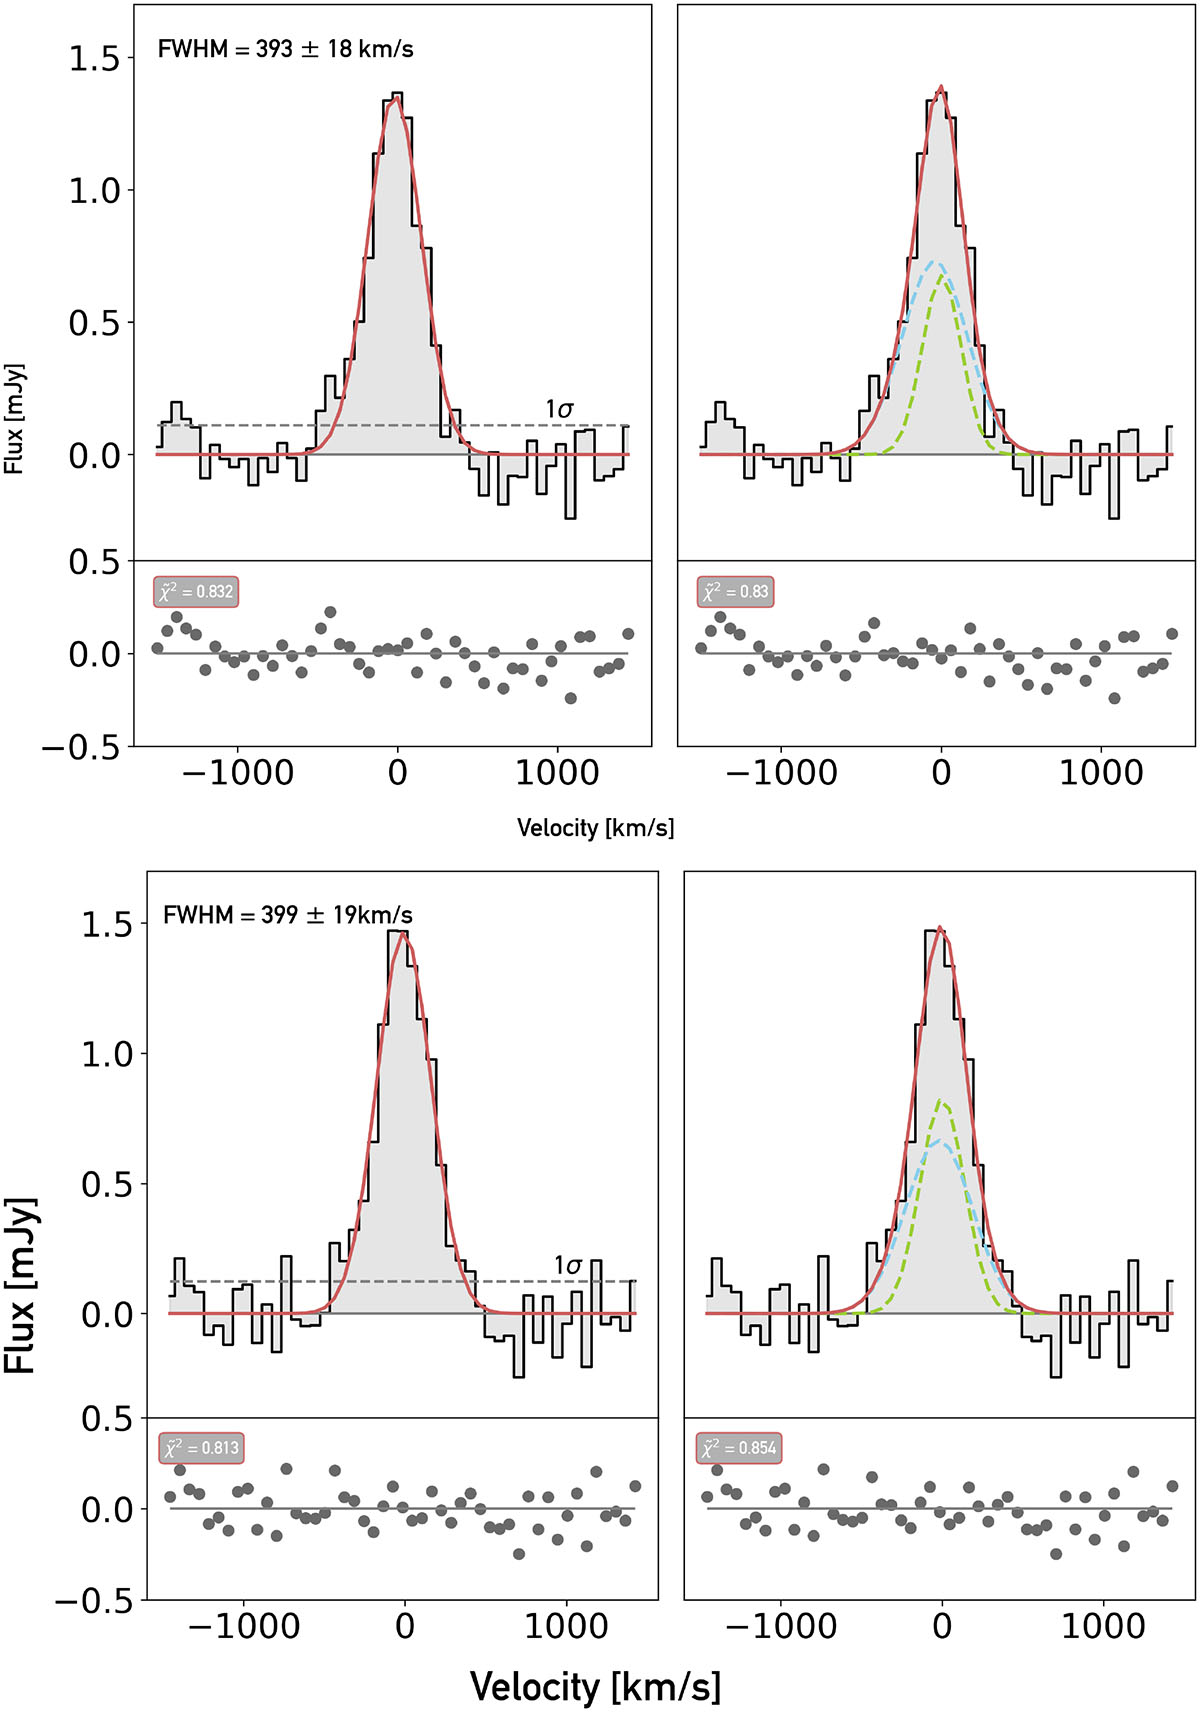
Fig. 8.
Download original image
Top panel: Spectrum of the uniformly stacked CO(2–1) emission (in black). Bottom panel: Spectrum of the CO(2–1) emission (in black) extracted from the uniformly stacked CO(2–1) cubes. In the left panel, we show a single-Gaussian fit (in red) and its residuals and corresponding reduced χ2 in the bottom panel. In the right panel, we show a two-Gaussian fit (the sum of the two Gaussians in red) composed of a narrow component (green dashed line) and a broad component (blue dashed line).
Current usage metrics show cumulative count of Article Views (full-text article views including HTML views, PDF and ePub downloads, according to the available data) and Abstracts Views on Vision4Press platform.
Data correspond to usage on the plateform after 2015. The current usage metrics is available 48-96 hours after online publication and is updated daily on week days.
Initial download of the metrics may take a while.