Fig. B.2.
Download original image
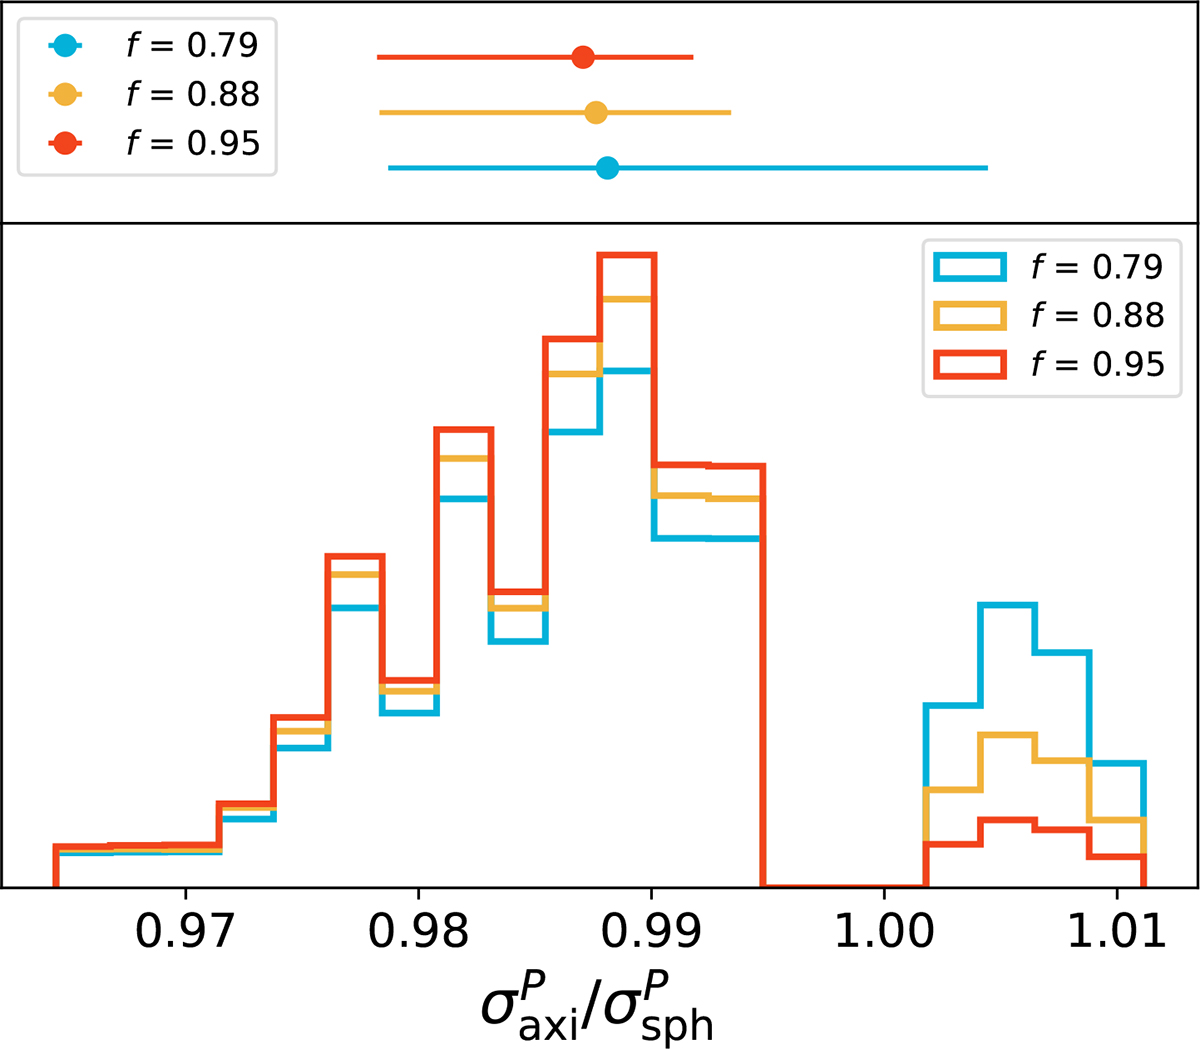
Lower panel: Normalized distribution of the correction term σaxiP/σsphP at q′ = 0.9 under different values of the oblate fraction f. Upper panel: 16th (left end of the errorbar), 50th (the central marker), and 84th (right end of the errorbar) percentile corresponding to the distribution of the correction term. The difference in the median σaxiP/σsphP at f = 0.79 and f = 0.95 is 0.105%, indicating that the relative change in the corrected velocity dispersion when f changes by two standard deviations is 0.105%. Therefore, the change in the inferred λ and H0 when f changes by one standard deviation is 0.105%.
Current usage metrics show cumulative count of Article Views (full-text article views including HTML views, PDF and ePub downloads, according to the available data) and Abstracts Views on Vision4Press platform.
Data correspond to usage on the plateform after 2015. The current usage metrics is available 48-96 hours after online publication and is updated daily on week days.
Initial download of the metrics may take a while.