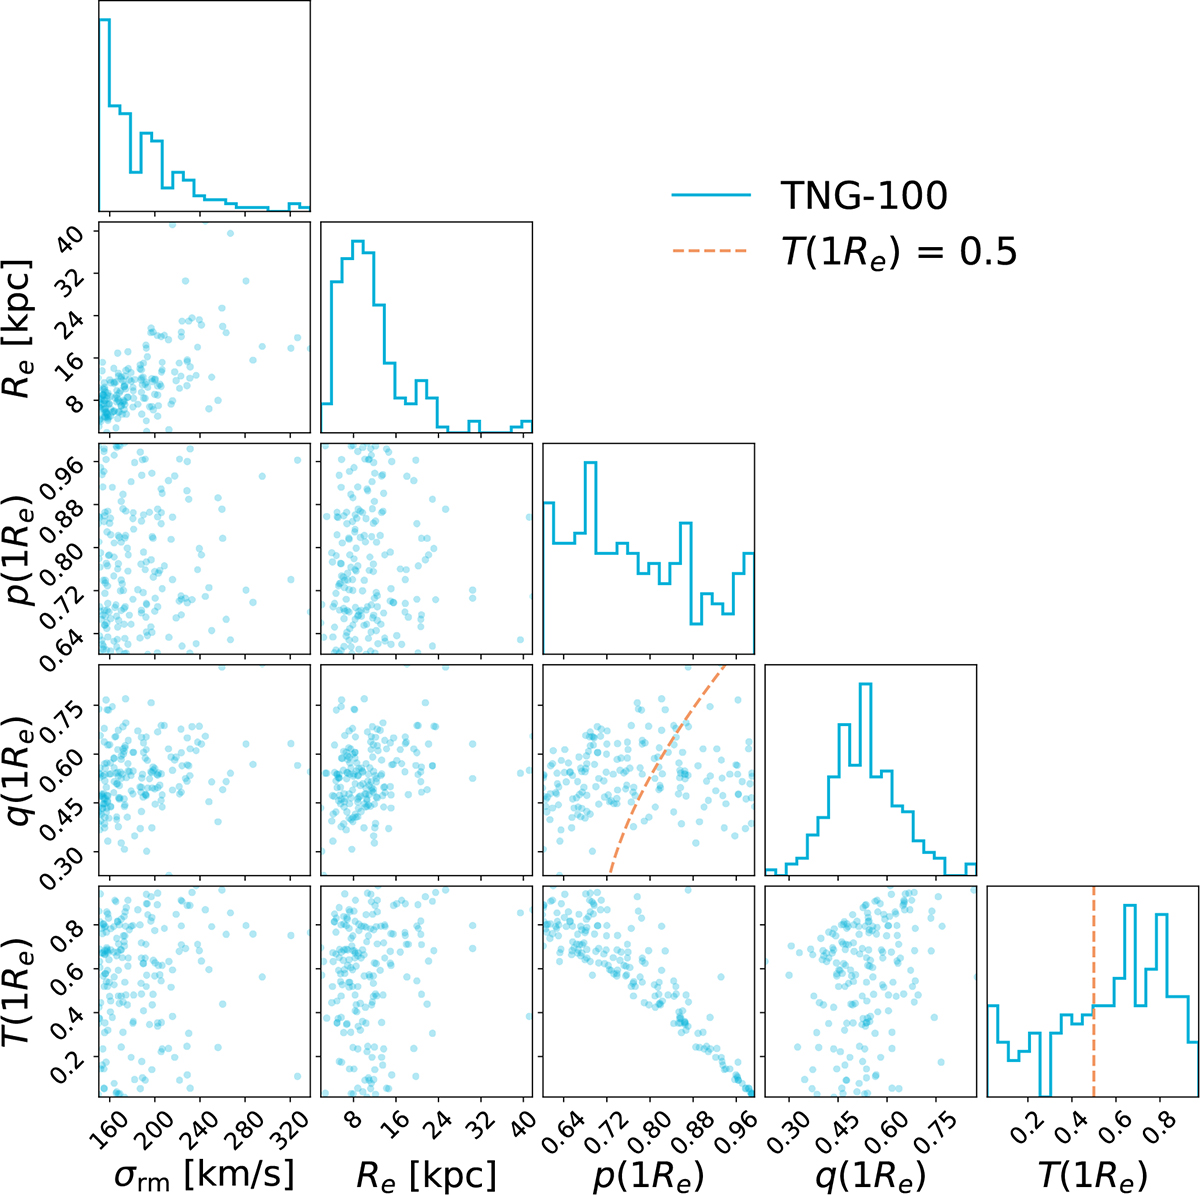
Fig. 2.
Download original image
Distribution of the velocity dispersion on a random LoS σrm, the effective radius Re, the intrinsic axis ratios p and q and the triaxiality parameter T for the selected ETG sample from them TNG100 simulation. Dashed line represent T = 0.5 in the p − q space and in the 1D histogram of T, which we used to separate the full sample into the “oblate” subsample and the “prolate” subsample.
Current usage metrics show cumulative count of Article Views (full-text article views including HTML views, PDF and ePub downloads, according to the available data) and Abstracts Views on Vision4Press platform.
Data correspond to usage on the plateform after 2015. The current usage metrics is available 48-96 hours after online publication and is updated daily on week days.
Initial download of the metrics may take a while.