Fig. 3.
Download original image
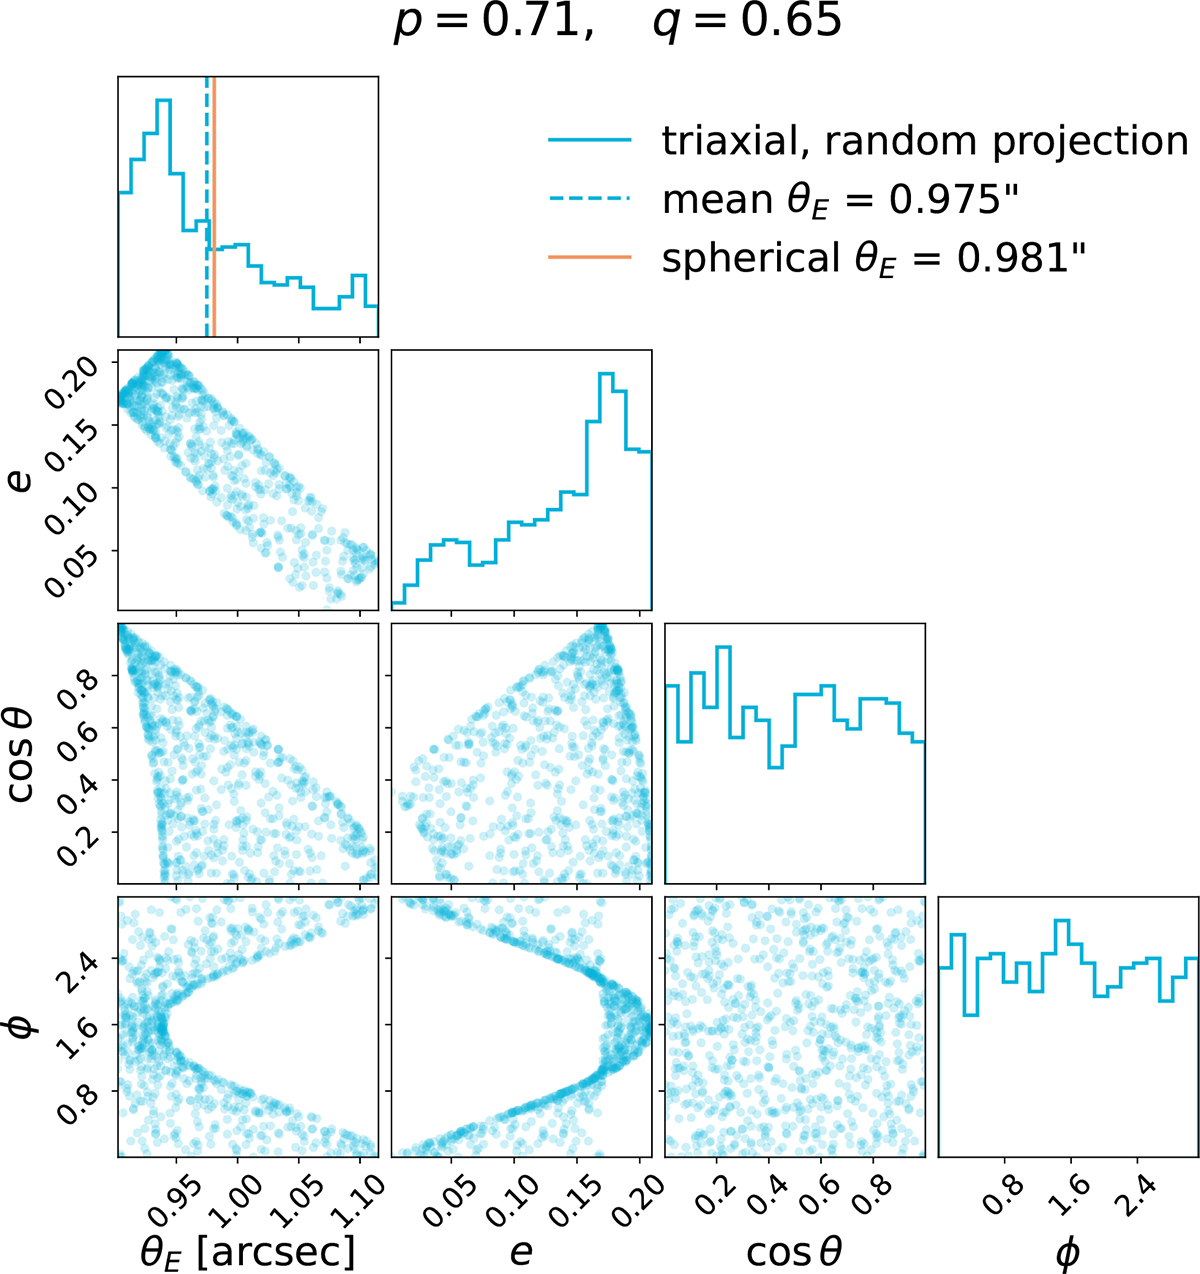
Illustration of the projection effect in the strong lensing observables. We start with 3D density profiles of lens galaxies and project onto random directions 800 times. Dashed blue line marks the mean of θE under random projections. Orange solid line marks the θE of a spherical lens of the same mass. The projection effect in lensing is reflected by the scattering of θE around the spherical value.
Current usage metrics show cumulative count of Article Views (full-text article views including HTML views, PDF and ePub downloads, according to the available data) and Abstracts Views on Vision4Press platform.
Data correspond to usage on the plateform after 2015. The current usage metrics is available 48-96 hours after online publication and is updated daily on week days.
Initial download of the metrics may take a while.