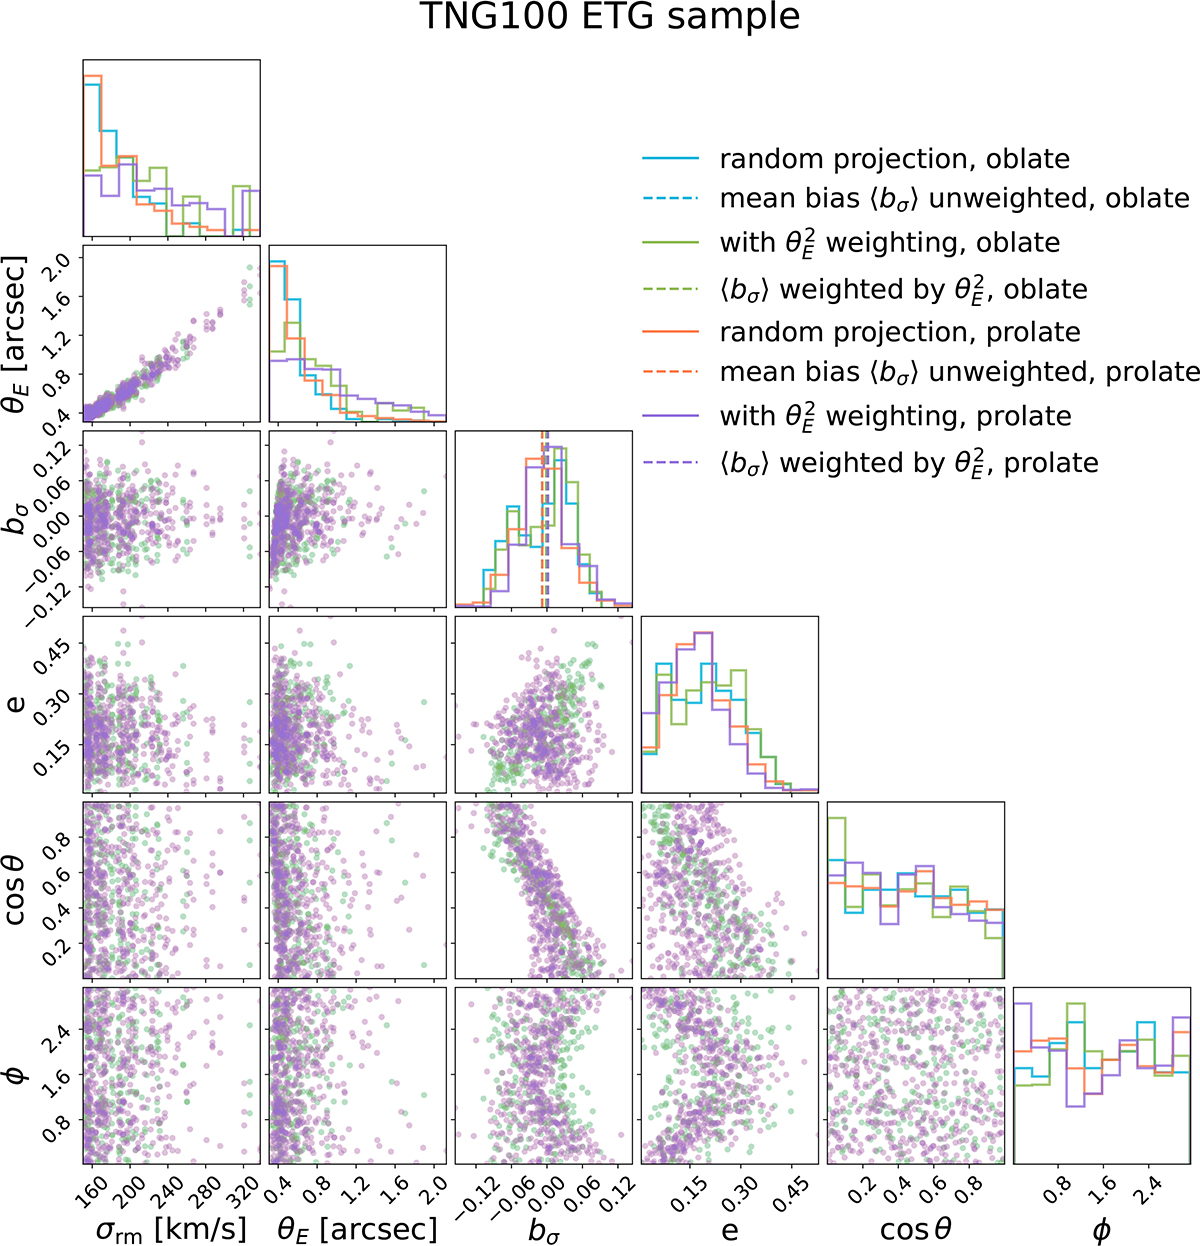
Fig. 4.
Download original image
Projection effect of the TNG-100 ETG sample. Each ETG is projected 4 times onto random directions (blue and coral histograms). Each dot in the 2D histograms represents a projection. We apply a lensing cross-section weighting proportional to θE2, as represented with the green and purple histograms. We model the lensing selection on the projected ellipticity e, showing that for the oblate sample, lensing selection favors more elliptical galaxies in projection, while for the prolate sample, the lensing selection favors rounder galaxies. For the oblates, the viewing angle θ equals the inclination angle i for pure oblates, and thus under lensing selection cos θ is also inclined to the lower end, i.e., towards higher inclination angles and consequently higher ellipticities. The “bias” in the kinematics under the assumption of SIS lens models bσ = σSIS/σrm − 1 is labeled with dashed lines. The mean bias ⟨bσ⟩ for the oblate sample, indicated with blue dashed lines, is directly under the coral dashed line representing ⟨bσ⟩ for the prolate sample and thus invisible from the plot.
Current usage metrics show cumulative count of Article Views (full-text article views including HTML views, PDF and ePub downloads, according to the available data) and Abstracts Views on Vision4Press platform.
Data correspond to usage on the plateform after 2015. The current usage metrics is available 48-96 hours after online publication and is updated daily on week days.
Initial download of the metrics may take a while.