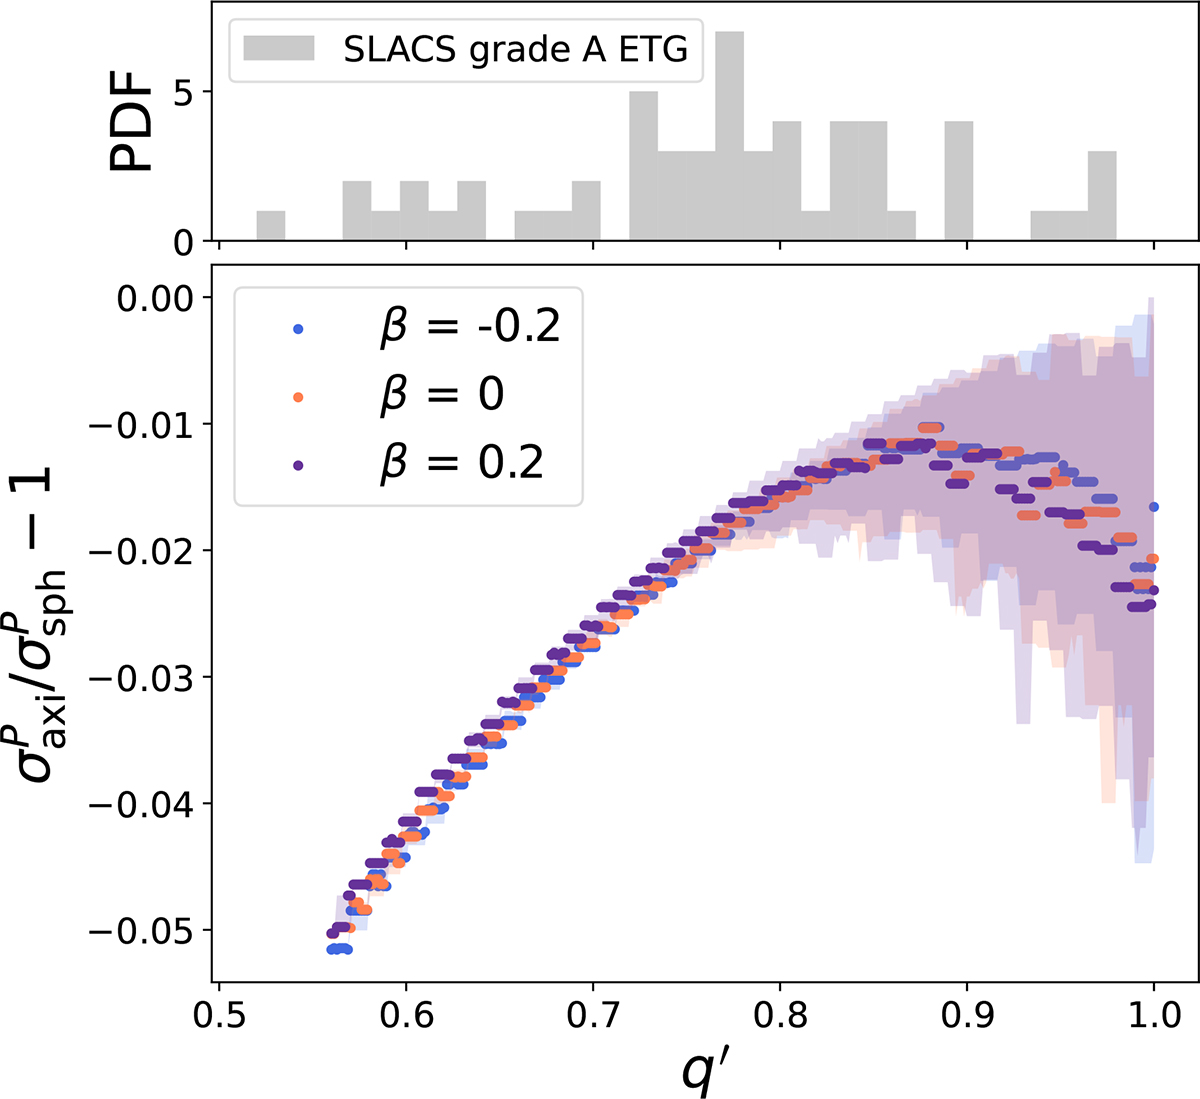
Fig. 8.
Download original image
Kinematics correction term σaxiP/σsphP − 1 versus the projected axis ratio q′ as a result of combining the two curves in Figure 7 (lower panel). We use the misalignment angle between the kinematics major axis and the photometric major axis of the SLACS lenses measured in Knabel et al. (2025b), and a simple model for the fraction of oblates in a population (see Appendix B), to determine the weight used to combine the two curves. The solid dots in the lower panel are the median of the conditional probability P(σaxiP/σsphP − 1|q′), while the shaded area is the 1σ interval. The upper panel is to illustrate the distribution of the projected axis ratios of the early-type SLACS lenses from Bolton et al. (2008). Averaging over all these SLACS lenses, and under the choice of β = 0, we obtain the median correction to be ![]() .
.
Current usage metrics show cumulative count of Article Views (full-text article views including HTML views, PDF and ePub downloads, according to the available data) and Abstracts Views on Vision4Press platform.
Data correspond to usage on the plateform after 2015. The current usage metrics is available 48-96 hours after online publication and is updated daily on week days.
Initial download of the metrics may take a while.