Fig. 14
Download original image
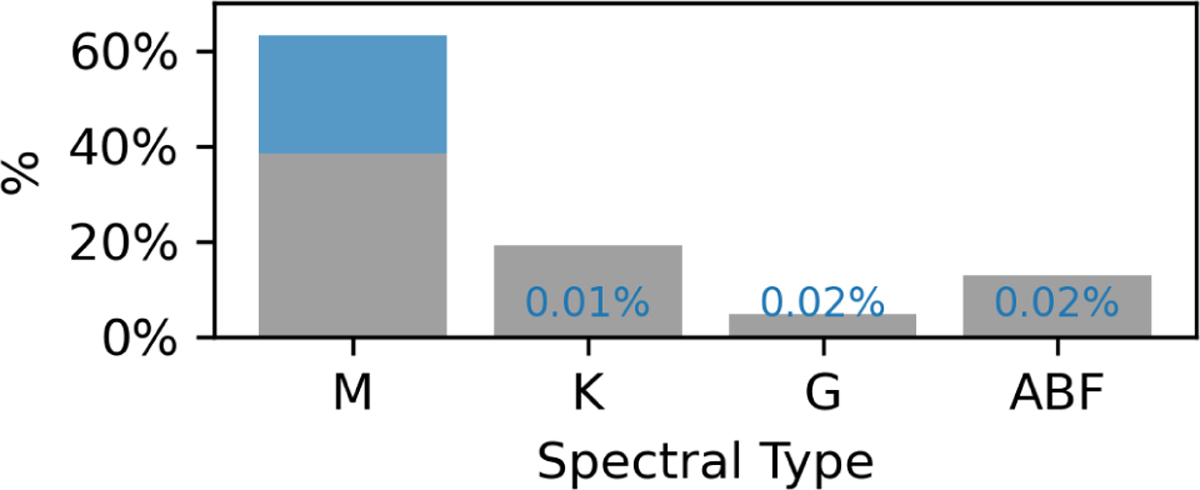
Percentage of sources in the YSO variable sample as a function of their spectral types. Spectral types derived in Appendix C.3 from their GSP-Phot effective temperatures are shown in grey, and in blue if derived from de-redden GBP - GRP colours. Bars too small for visualisation have their fractional contribution written in the plot.
Current usage metrics show cumulative count of Article Views (full-text article views including HTML views, PDF and ePub downloads, according to the available data) and Abstracts Views on Vision4Press platform.
Data correspond to usage on the plateform after 2015. The current usage metrics is available 48-96 hours after online publication and is updated daily on week days.
Initial download of the metrics may take a while.