Fig. 16
Download original image
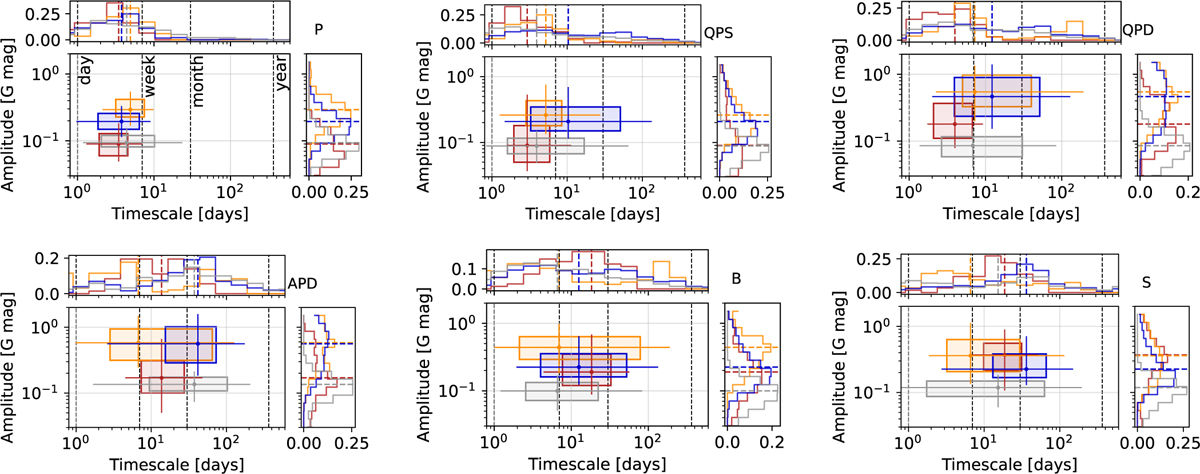
Box plots of the timescale-amplitude distributions are shown for six morphology classes defined by the Q-M indices, along with normalised histograms for each parameter. The primary sample is plotted in blue and the secondary sample in grey. High-cadence space-based sources (CoRoT, K2) and ground-based ZTF results are shown in red and orange.
Current usage metrics show cumulative count of Article Views (full-text article views including HTML views, PDF and ePub downloads, according to the available data) and Abstracts Views on Vision4Press platform.
Data correspond to usage on the plateform after 2015. The current usage metrics is available 48-96 hours after online publication and is updated daily on week days.
Initial download of the metrics may take a while.