Open Access
Fig. 17
Download original image
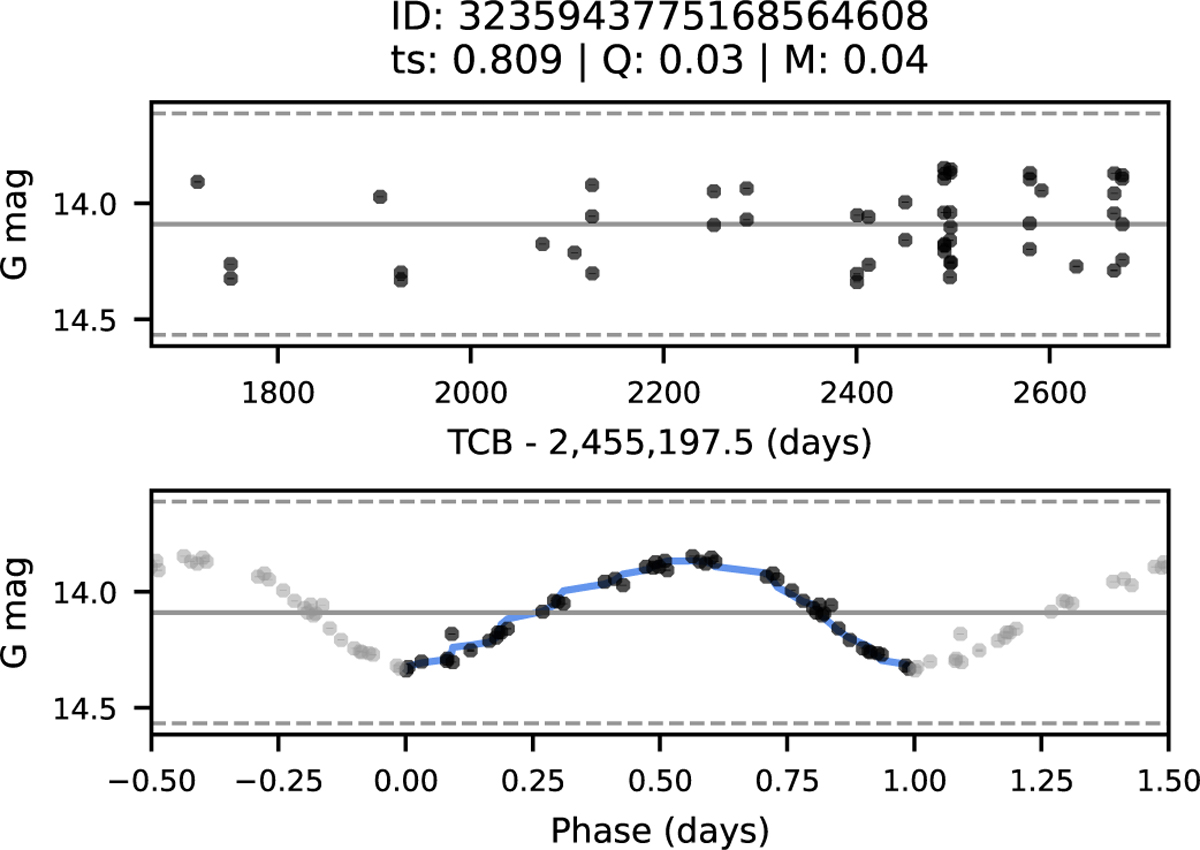
Example of a P variable. Top: Full G light curve. Bottom: Phase-folded light curve. The blue line represents the waveform used in the Q calculation, the grey line indicates the mean magnitude, and the dashed lines mark the 3σ variation bounds. Same descriptions applies to all following figures until Fig. 24.
Current usage metrics show cumulative count of Article Views (full-text article views including HTML views, PDF and ePub downloads, according to the available data) and Abstracts Views on Vision4Press platform.
Data correspond to usage on the plateform after 2015. The current usage metrics is available 48-96 hours after online publication and is updated daily on week days.
Initial download of the metrics may take a while.