Fig. 3
Download original image
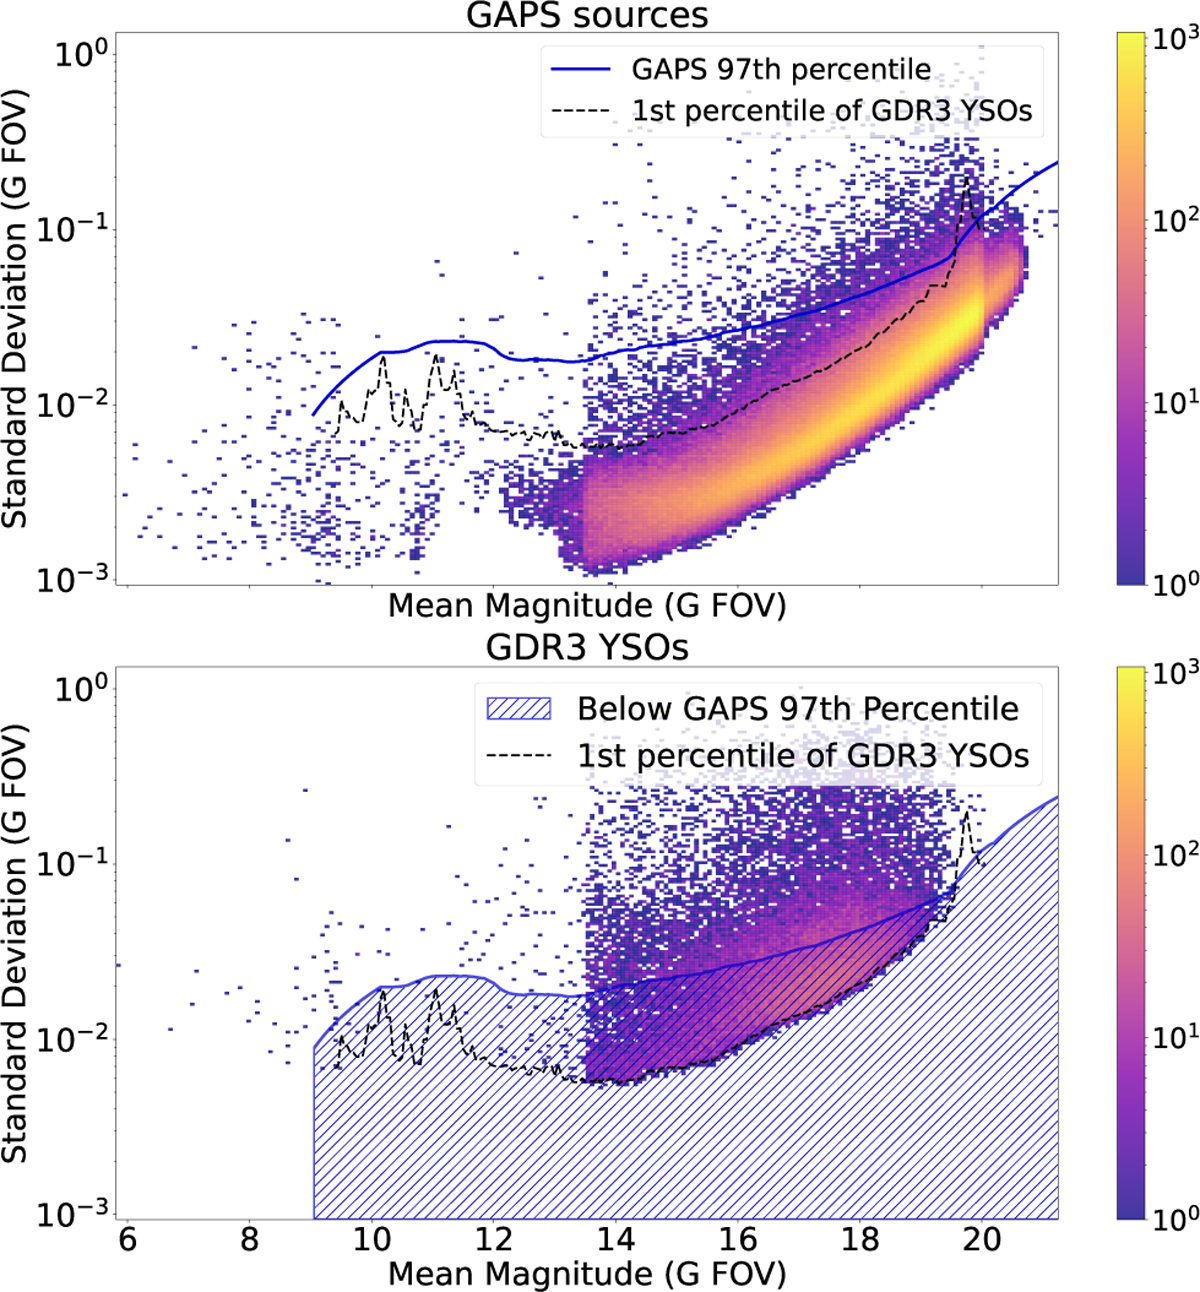
Standard deviation versus G magnitude for light curves in the GAPS (top) and YSO (bottom) samples. The colour bar indicates source counts. The solid blue line marks the 97th percentile for the GAPS sample, and the hatched region identifies YSO sources lying below this percentile (secondary sample), while primary-sample sources lie above it. In both panels, the black dashed line shows the lower envelope (1st rolling percentile) of the YSO distribution to aid visual comparison.
Current usage metrics show cumulative count of Article Views (full-text article views including HTML views, PDF and ePub downloads, according to the available data) and Abstracts Views on Vision4Press platform.
Data correspond to usage on the plateform after 2015. The current usage metrics is available 48-96 hours after online publication and is updated daily on week days.
Initial download of the metrics may take a while.