Fig. B.1
Download original image
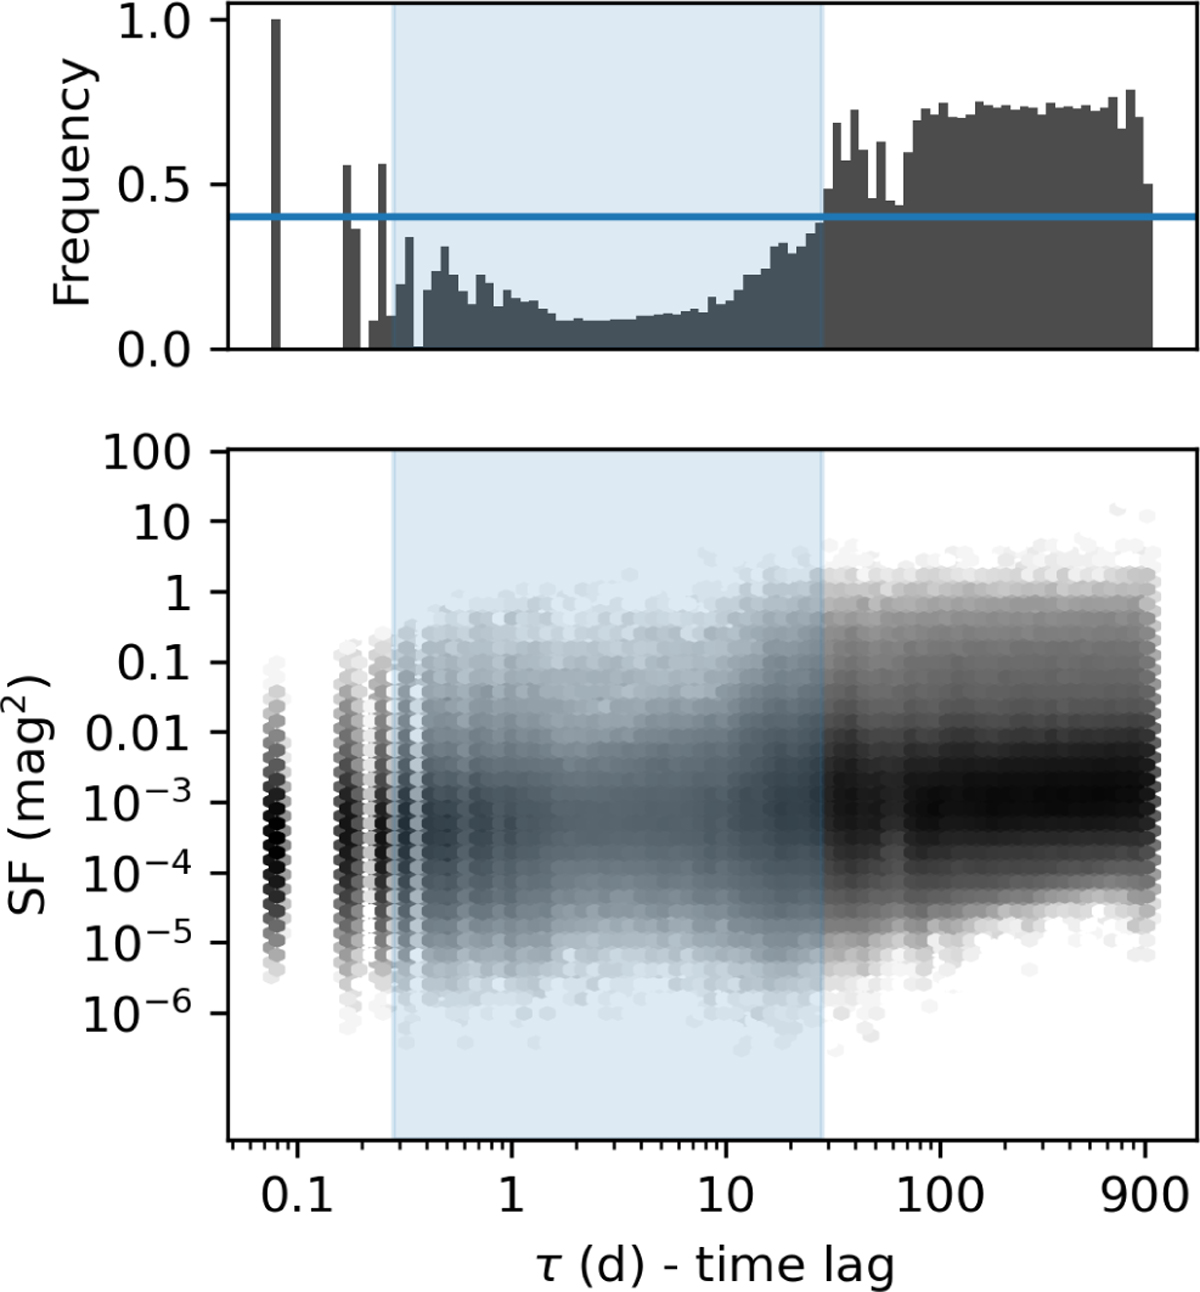
Bottom: Structure function and time difference pairs considering all SF-points (τ, SF) for all the 43 840 sources with enough number of epochs (Sect. 3.2). The blue region shows the depletion of pairs with τ between 0.3 and 28 days, introduced by limitation in the Gaia timeseries sampling. Top: Distribution of τ as a function of the frequency in which sources had a valid SF(τ). The blue horizontal line shows the 40% limit used to infer the blind timescale range of Gaia.
Current usage metrics show cumulative count of Article Views (full-text article views including HTML views, PDF and ePub downloads, according to the available data) and Abstracts Views on Vision4Press platform.
Data correspond to usage on the plateform after 2015. The current usage metrics is available 48-96 hours after online publication and is updated daily on week days.
Initial download of the metrics may take a while.