Open Access
Fig. 5
Download original image
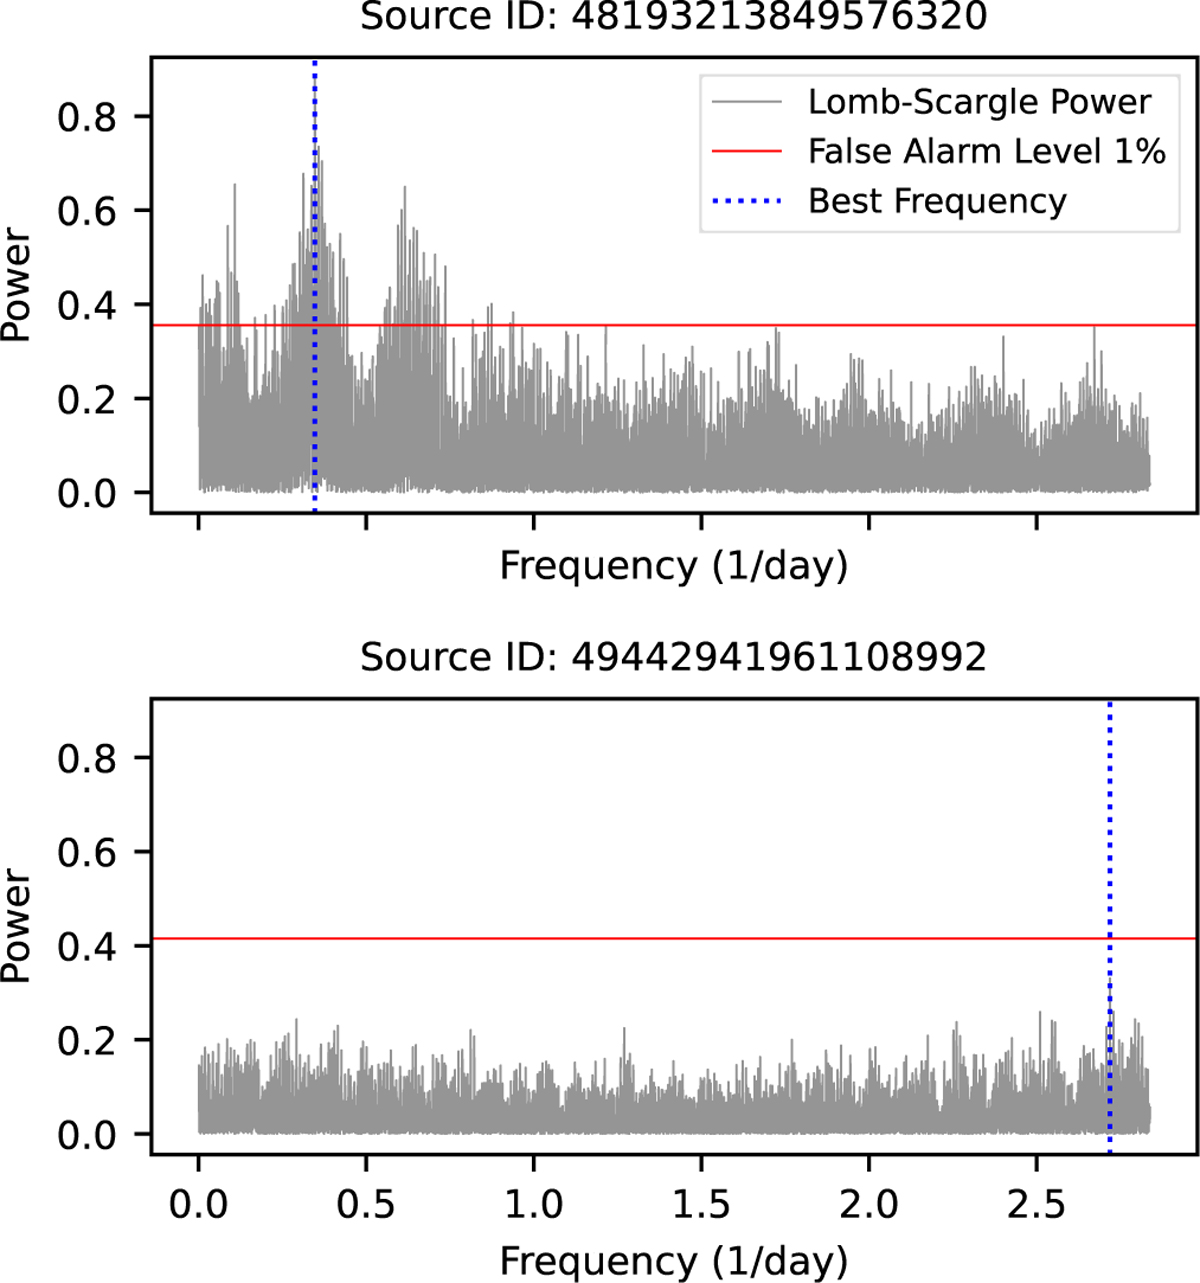
Example GLS periodograms used to derive periodic timescales. The upper panel shows a periodogram with a peak above the 1% FAL, from which a periodic timescale is obtained, while the lower panel shows a case with no such peak, where an aperiodic timescale is instead derived from the structure function.
Current usage metrics show cumulative count of Article Views (full-text article views including HTML views, PDF and ePub downloads, according to the available data) and Abstracts Views on Vision4Press platform.
Data correspond to usage on the plateform after 2015. The current usage metrics is available 48-96 hours after online publication and is updated daily on week days.
Initial download of the metrics may take a while.