Fig. 8
Download original image
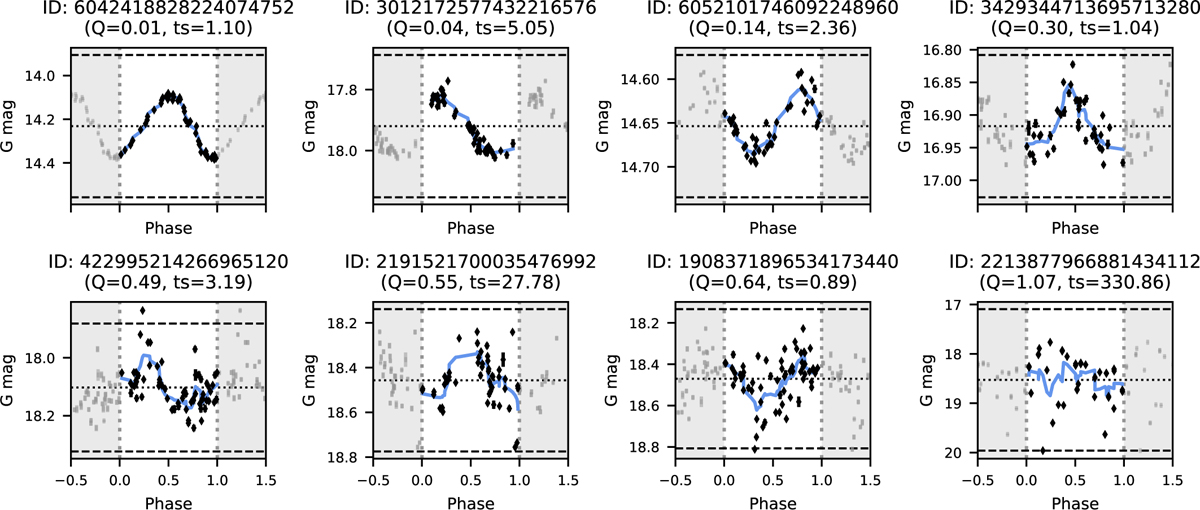
Phase-folded GDR3 light curves are shown with Q values increasing from left to right. Black diamonds indicate the phase-folded epoch photometry, while the blue line represents the inferred waveform. The grey region marks the extended phase for clarity. Grey horizontal lines denote the mean (dotted) and the mean ±3× std (dashed).
Current usage metrics show cumulative count of Article Views (full-text article views including HTML views, PDF and ePub downloads, according to the available data) and Abstracts Views on Vision4Press platform.
Data correspond to usage on the plateform after 2015. The current usage metrics is available 48-96 hours after online publication and is updated daily on week days.
Initial download of the metrics may take a while.