Open Access
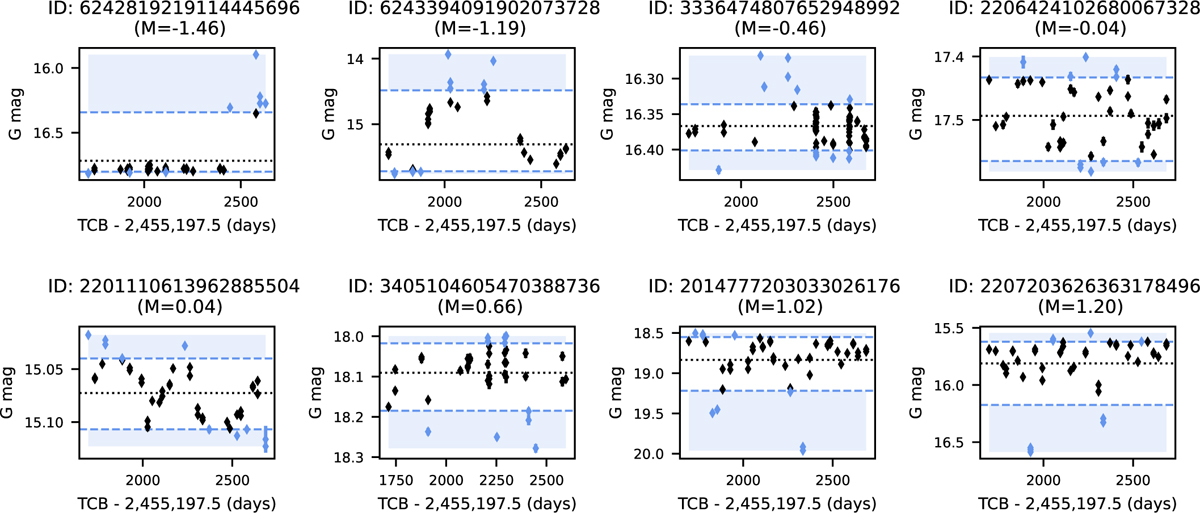
Fig. 9
Download original image
Examples of GDR3 light curves with increasing M values from left to right. The blue diamonds are the data points of the top and bottom deciles of the curve; the grey dotted line shows the mean; the blue dashed lines show the top and bottom deciles. The time axis reflects the observations’ Barycentric Coordinate Time (TCB).
Current usage metrics show cumulative count of Article Views (full-text article views including HTML views, PDF and ePub downloads, according to the available data) and Abstracts Views on Vision4Press platform.
Data correspond to usage on the plateform after 2015. The current usage metrics is available 48-96 hours after online publication and is updated daily on week days.
Initial download of the metrics may take a while.