Fig. G.1
Download original image
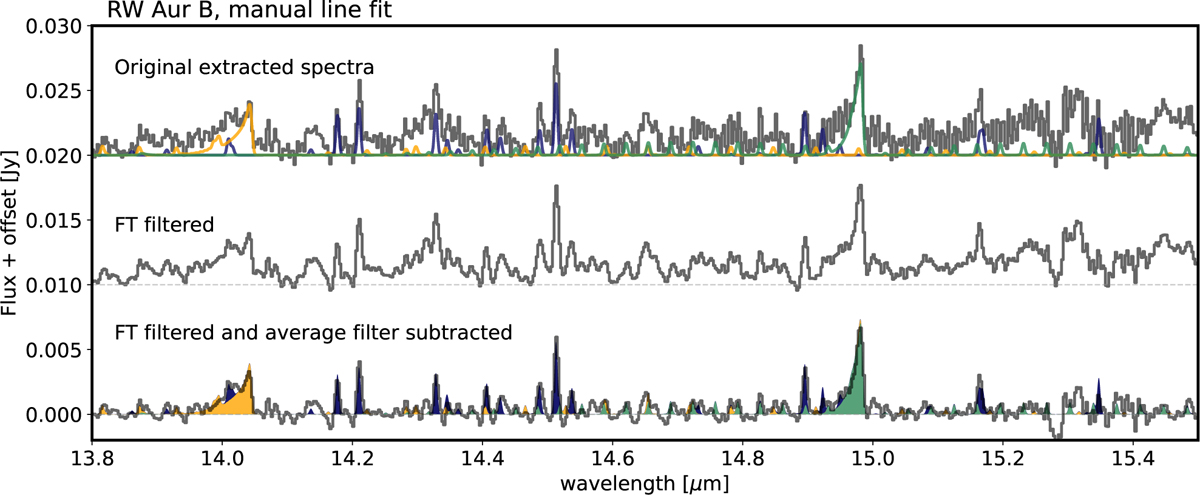
Molecular line emission of RW Aur B. In the top is the original continuum subtracted spectra, with the same continuum subtraction algorithm used for the primary disks. In the middle is the spectra after filtering the signals with frequency smaller than than 0.5 px−1. In the bottom, the spectra after frequency filtering and subtracting a masked average with a window size of 10 px. For reference, slab models for HCN, H2O, and CO2, are shown with the original and with the modified spectra.
Current usage metrics show cumulative count of Article Views (full-text article views including HTML views, PDF and ePub downloads, according to the available data) and Abstracts Views on Vision4Press platform.
Data correspond to usage on the plateform after 2015. The current usage metrics is available 48-96 hours after online publication and is updated daily on week days.
Initial download of the metrics may take a while.