Fig. H.2
Download original image
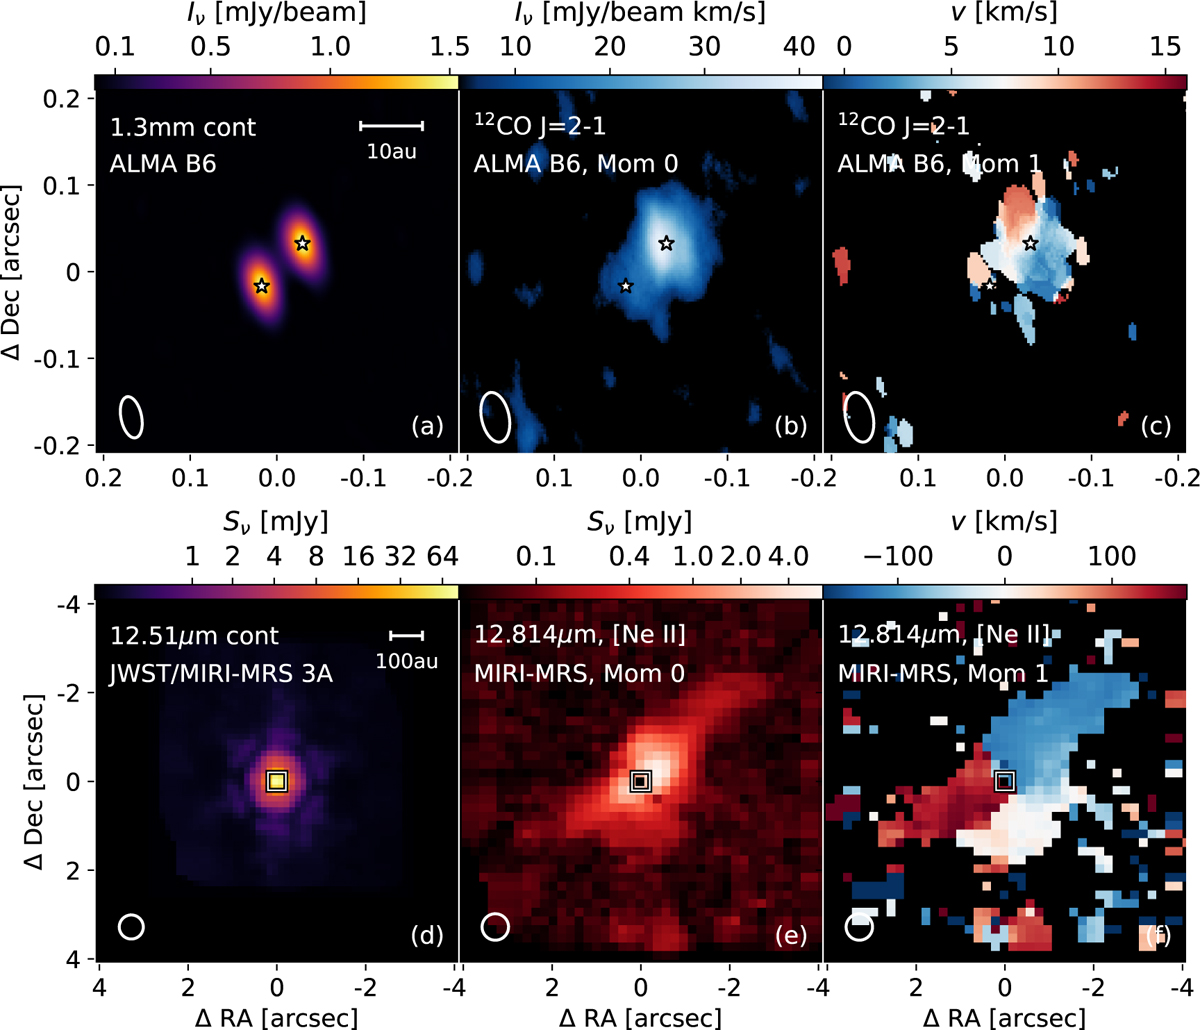
DF Tau as observed with ALMA (upper panels), as shown from left to right: 1.3 mm dust continuum emission, 12CO J=2-1 moment 0, and 12CO J=2-1 moment 1. These datasets were presented in Grant et al. (2024b). In the lower panels show the MIRI-MRS observations, from left to right: The 12.51 μm continuum emission, the moment 0 frequency of [Ne II], and the velocity at peak emission of [Ne II] relative to the rest frequency. The ellipse in the corner of each panel represents the FWHM of the PSF of each image. The box at the center of panels (d, e, f) shows the spatial extent of panels (a,b,c).
Current usage metrics show cumulative count of Article Views (full-text article views including HTML views, PDF and ePub downloads, according to the available data) and Abstracts Views on Vision4Press platform.
Data correspond to usage on the plateform after 2015. The current usage metrics is available 48-96 hours after online publication and is updated daily on week days.
Initial download of the metrics may take a while.