Fig. 3
Download original image
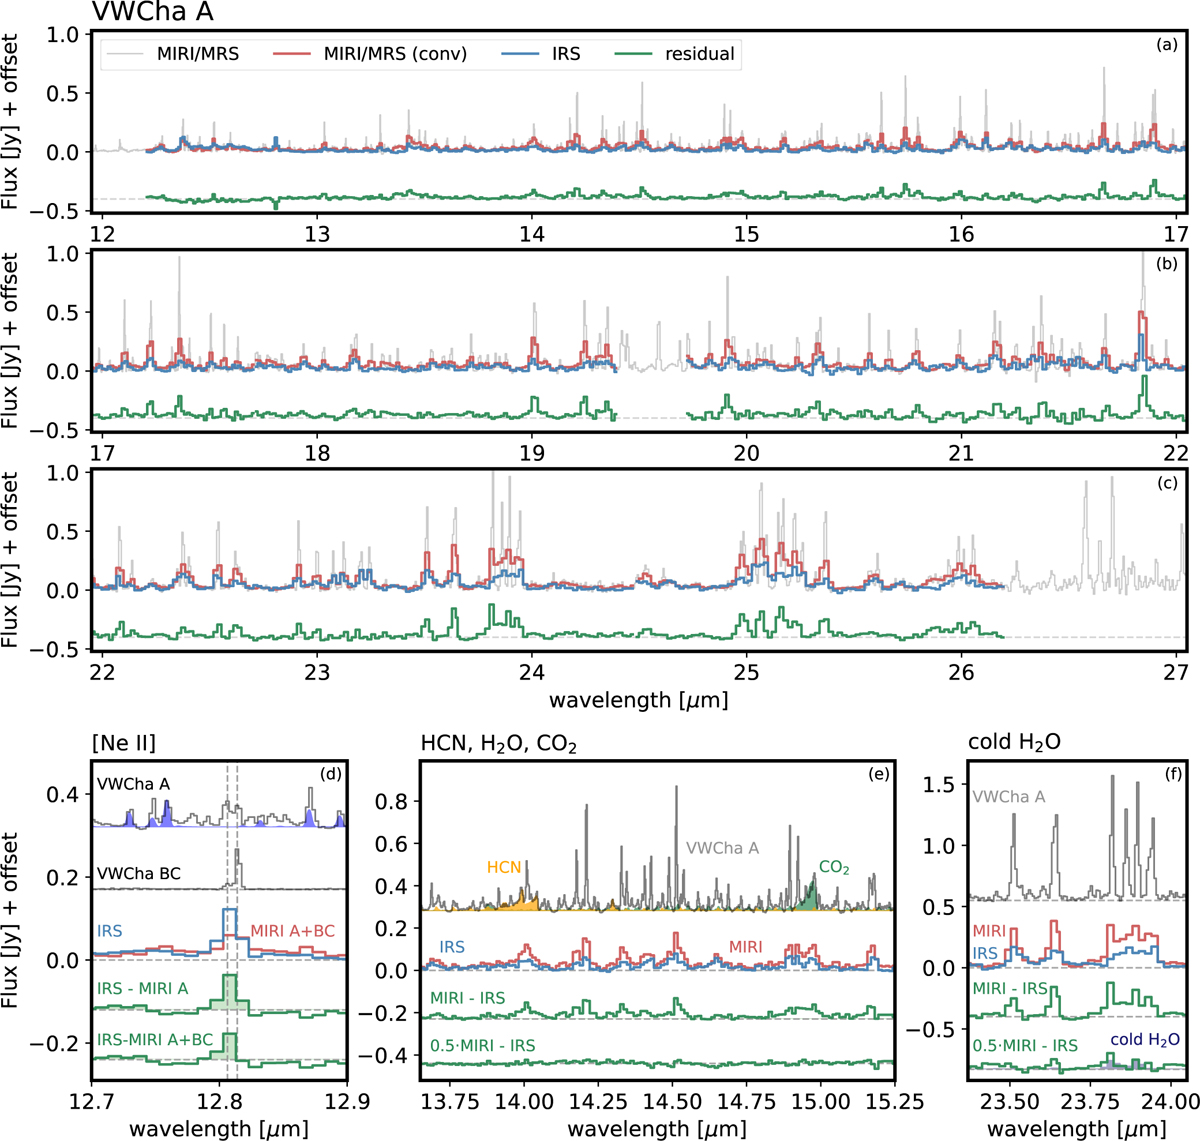
Comparison of the JWST/MIRI-MRS spectra and Spitzer/IRS in mode SH and LH. Panels (a), (b), and (c) show the comparison of MIRI-MRS with native resolution in grey, and in red after being convolved to the IRS resolution. The IRS spectra is shown in blue. The residuals from subtracting the IRS spectra to the MIRI-MRS are shown in green. Panel (d) is a zoom into the [Ne II] emission, with two vertical dashed lines showing the location of the [Ne II] at rest and the wavelength of [Ne II] with −180 km s−1 of blueshift. The emission of VW Cha BC is also shown, and convolved to the resolution of the IRS. Panel (e) is a zoom into the region with the main emission of HCN and CO2. For comparison, the residuals from subtracting the IRS observation to the MIRI-MRS observation are shown both with their real flux and with the MIRI-MRS flux scaled by 0.5. Panel (f) shows the region with the most prominent cold H2O lines. Even after scaling MIRI-MRS by 0.5, there are still residuals consistent with a 200 K slab.
Current usage metrics show cumulative count of Article Views (full-text article views including HTML views, PDF and ePub downloads, according to the available data) and Abstracts Views on Vision4Press platform.
Data correspond to usage on the plateform after 2015. The current usage metrics is available 48-96 hours after online publication and is updated daily on week days.
Initial download of the metrics may take a while.