Fig. 6
Download original image
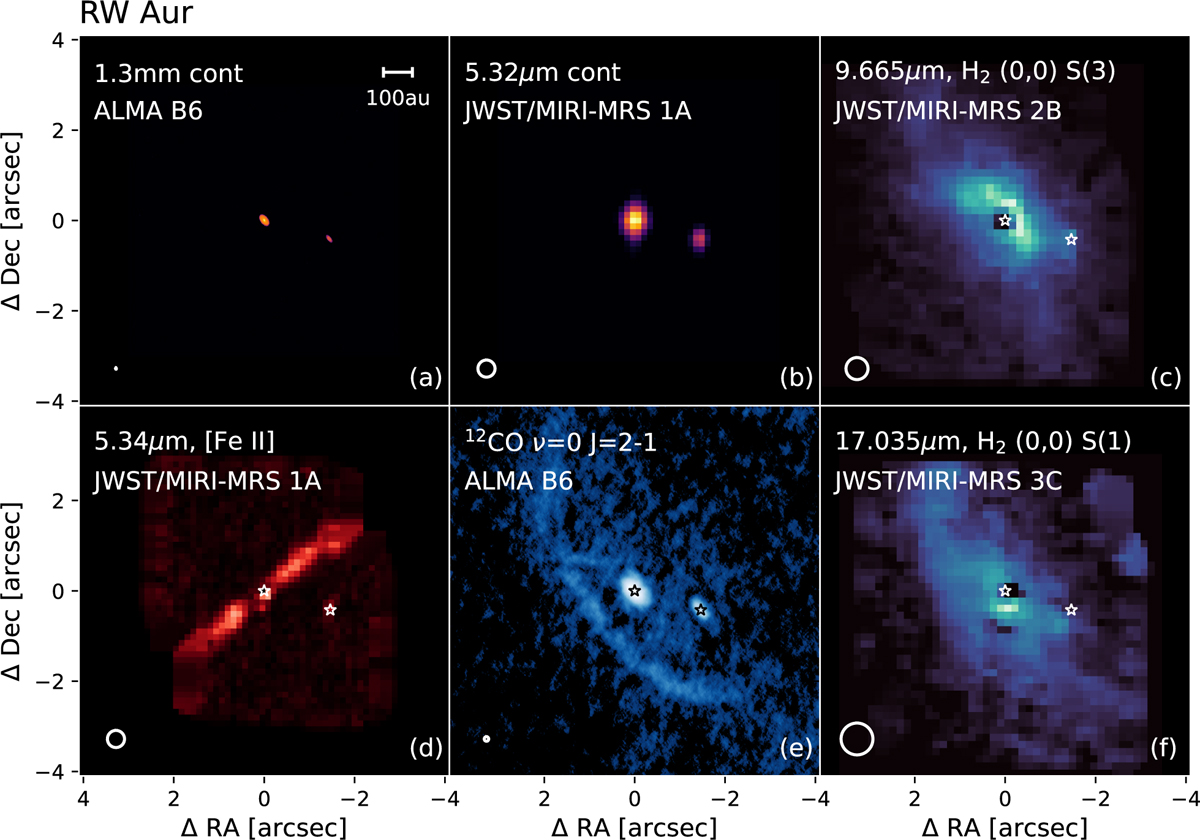
≈1000 au environment of RW Aur at different wavelengths, as observed by ALMA and JWST. Panel (a) Compact dust continuum emission at 1.3 mm wavelength (see Kurtovic et al. 2024, for a detailed study). Panel (b) Continuum emission from MIRI-MRS subband 1A. Panel (c) Peak emission map of H2 S(3). Panel (d) Peak emission map of [Fe II]. Panel (e) Moment 0 map of the 12CO emission at 230.538 GHz, as observed with ALMA. Panel (f) Peak emission map of H2 S(3).
Current usage metrics show cumulative count of Article Views (full-text article views including HTML views, PDF and ePub downloads, according to the available data) and Abstracts Views on Vision4Press platform.
Data correspond to usage on the plateform after 2015. The current usage metrics is available 48-96 hours after online publication and is updated daily on week days.
Initial download of the metrics may take a while.