Fig. 8
Download original image
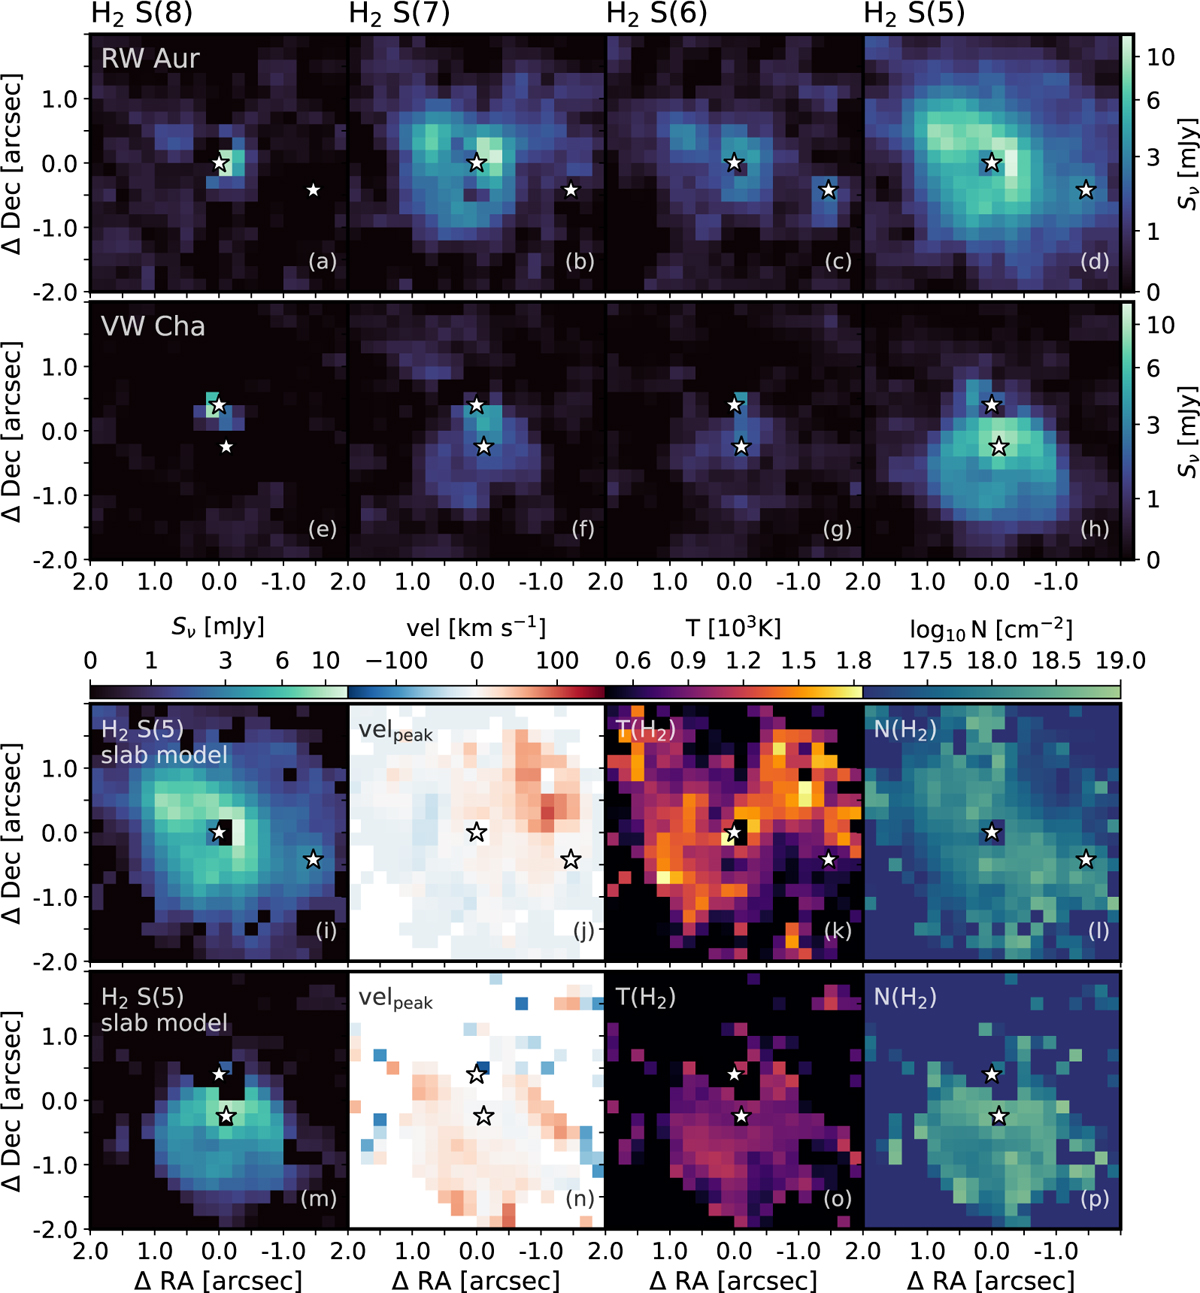
Pixel-by-pixel model for the H2 in the transitions S(5) to S(8) toward RW Aur (emission in panels a–d) and VW Cha (emission in panels e–h), all in the MIRI-MRS field of view between band 1A to 1C. The upper rows show the resampled H2 images (panels a-h), while the lower rows show the best model results (panels i-1 for RW Aur, and panels m-p for VW Cha). Panels (i) and (m) show the best model for H2 S(5), panels (j) and (n) show the centroid velocity in the same line, panels (k) and (o) show the maximum likelihood slab temperature, and panels (l) and (p) show the maximum likelihood slab column density.
Current usage metrics show cumulative count of Article Views (full-text article views including HTML views, PDF and ePub downloads, according to the available data) and Abstracts Views on Vision4Press platform.
Data correspond to usage on the plateform after 2015. The current usage metrics is available 48-96 hours after online publication and is updated daily on week days.
Initial download of the metrics may take a while.