Fig. 3
Download original image
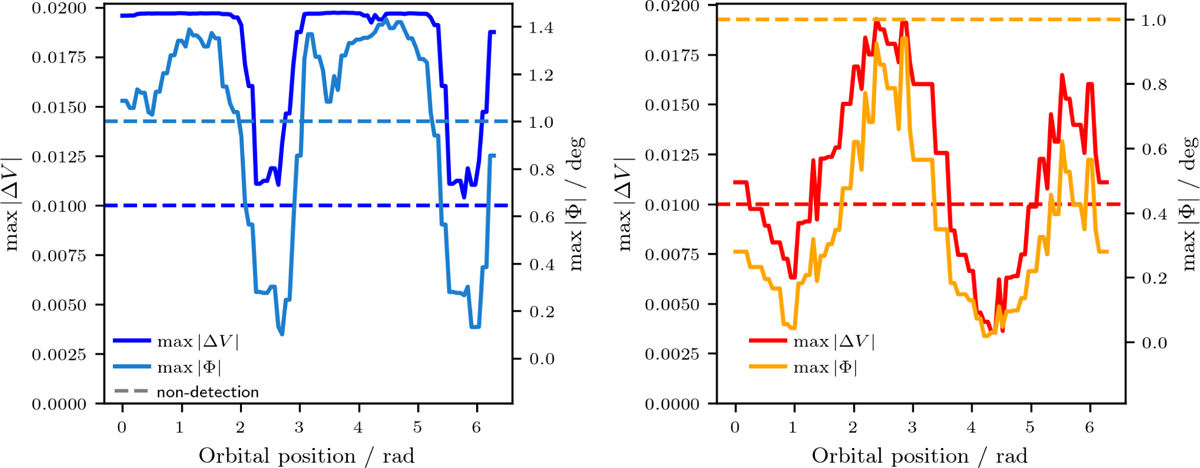
Theoretical variation of the maximum visibility deficit max |Δ V| and the maximum closure phase max |Φ| along the trajectory of the face-on (blue) orbit (left) and inclined (red) orbit (right) in the direction shown by the arrows displayed in Fig. 2. The dashed lines indicate the adopted generic detection limits: a visibility deficit of Δ V=0.01 and a closure phase of Φ=1°. Their colors match those of the corresponding observables. Detection limits are discussed in detail in Sect. 3.2.
Current usage metrics show cumulative count of Article Views (full-text article views including HTML views, PDF and ePub downloads, according to the available data) and Abstracts Views on Vision4Press platform.
Data correspond to usage on the plateform after 2015. The current usage metrics is available 48-96 hours after online publication and is updated daily on week days.
Initial download of the metrics may take a while.