Fig. 7
Download original image
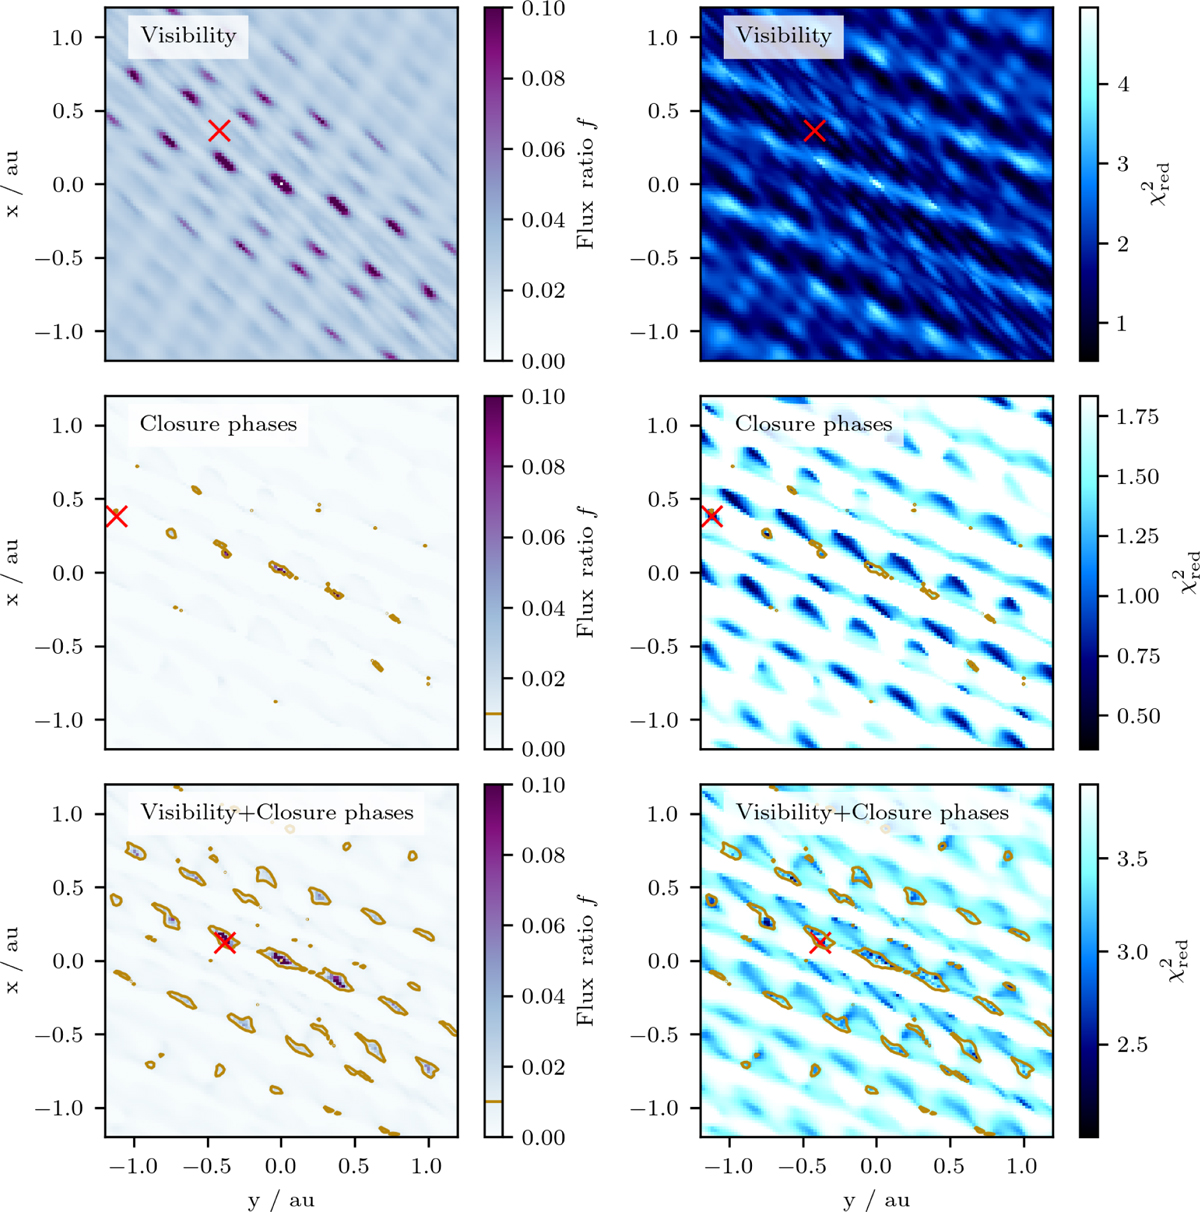
Left: best fit for companion-to-star flux ratio, f, for measurements of κ Tuc A. Right: ![]() for the position-dependent best-fit flux ratio. Each row corresponds to the different data used for fitting: visibility measurements (top), closure phases measurements (middle), and both visibility and closure phase measurements (bottom). Contour line in the middle and bottom plot mark the regions, where the flux ratio exceeds 1%. Red crosses mark the pixel position corresponding to the minimum
for the position-dependent best-fit flux ratio. Each row corresponds to the different data used for fitting: visibility measurements (top), closure phases measurements (middle), and both visibility and closure phase measurements (bottom). Contour line in the middle and bottom plot mark the regions, where the flux ratio exceeds 1%. Red crosses mark the pixel position corresponding to the minimum ![]() value in each case.
value in each case.
Current usage metrics show cumulative count of Article Views (full-text article views including HTML views, PDF and ePub downloads, according to the available data) and Abstracts Views on Vision4Press platform.
Data correspond to usage on the plateform after 2015. The current usage metrics is available 48-96 hours after online publication and is updated daily on week days.
Initial download of the metrics may take a while.