Open Access
Fig. 10
Download original image
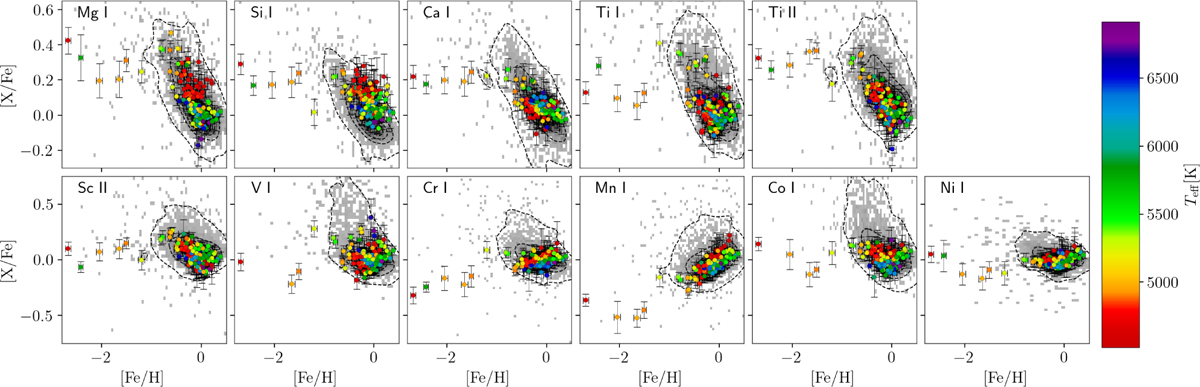
[X/Fe] vs [Fe/H] for all the elements analysed in this paper, coloured by effective temperature. The UVES data from the Gaia-ESO survey are overplotted with a 2D histogram and contour lines. Notice the change of the Y scale between the top and bottom panels.
Current usage metrics show cumulative count of Article Views (full-text article views including HTML views, PDF and ePub downloads, according to the available data) and Abstracts Views on Vision4Press platform.
Data correspond to usage on the plateform after 2015. The current usage metrics is available 48-96 hours after online publication and is updated daily on week days.
Initial download of the metrics may take a while.