Open Access
Fig. A.1
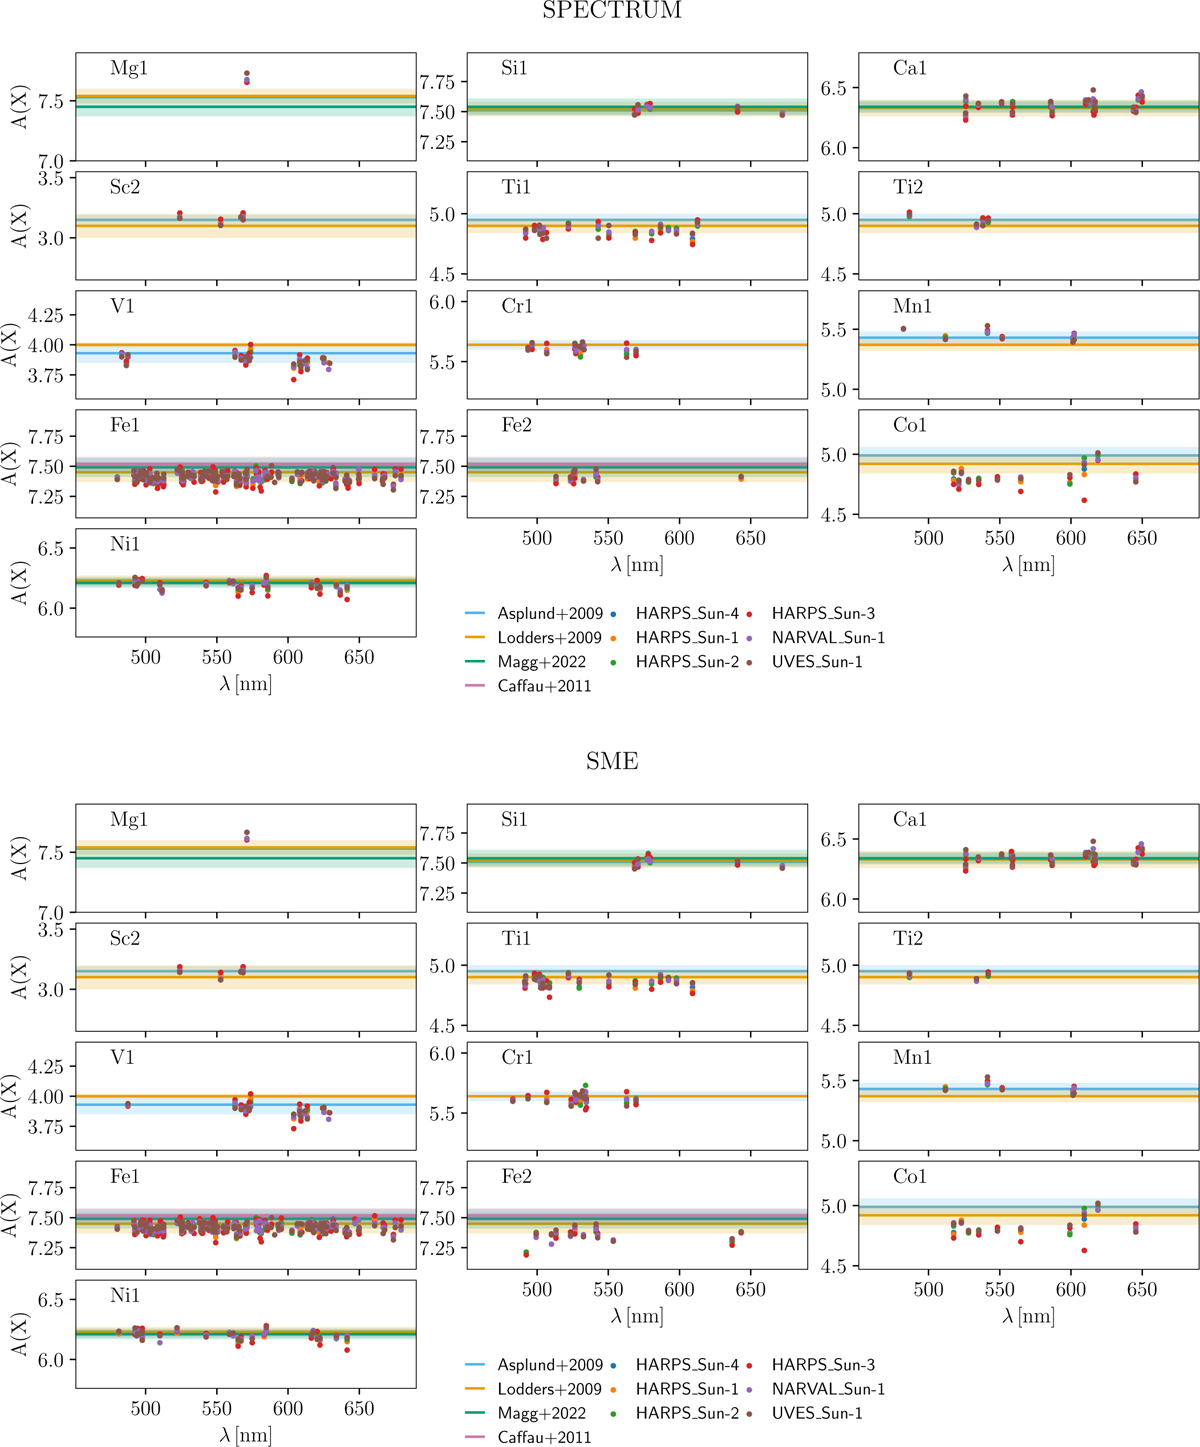
Download original image
Line by line absolute abundances of the selection of lines performed in Sect. 4 in the six solar spectra. Horizontal lines represent literature values of the solar abundances, with their uncertainties represented as shadowed regions. Selection done for SPECTRUM (top), and SME (bottom)
Current usage metrics show cumulative count of Article Views (full-text article views including HTML views, PDF and ePub downloads, according to the available data) and Abstracts Views on Vision4Press platform.
Data correspond to usage on the plateform after 2015. The current usage metrics is available 48-96 hours after online publication and is updated daily on week days.
Initial download of the metrics may take a while.